When a query becomes slow, the first instinct is often to add more CPU or increase memory. In reality, the problem may have nothing to do with hardware.
A query can be slow because it scans too much data, performs expensive calculations, uses excessive memory, or transfers large amounts of data across the network. Without profiling, these bottlenecks are difficult to distinguish because they often produce similar symptoms: high query latency.
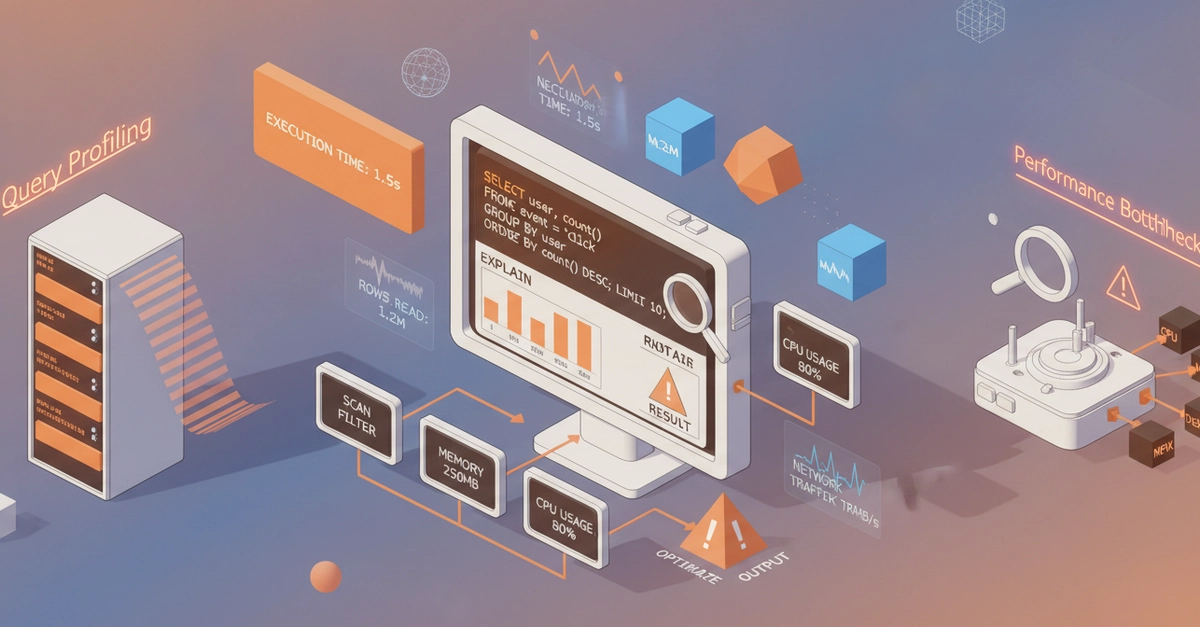
ClickHouse® provides built-in profiling tools that expose detailed execution statistics, making it possible to understand why a query is slow before attempting optimization.
In this article, we'll explore how to profile queries in ClickHouse®, interpret the most important metrics, and identify common performance bottlenecks.
Why Query Profiling Matters