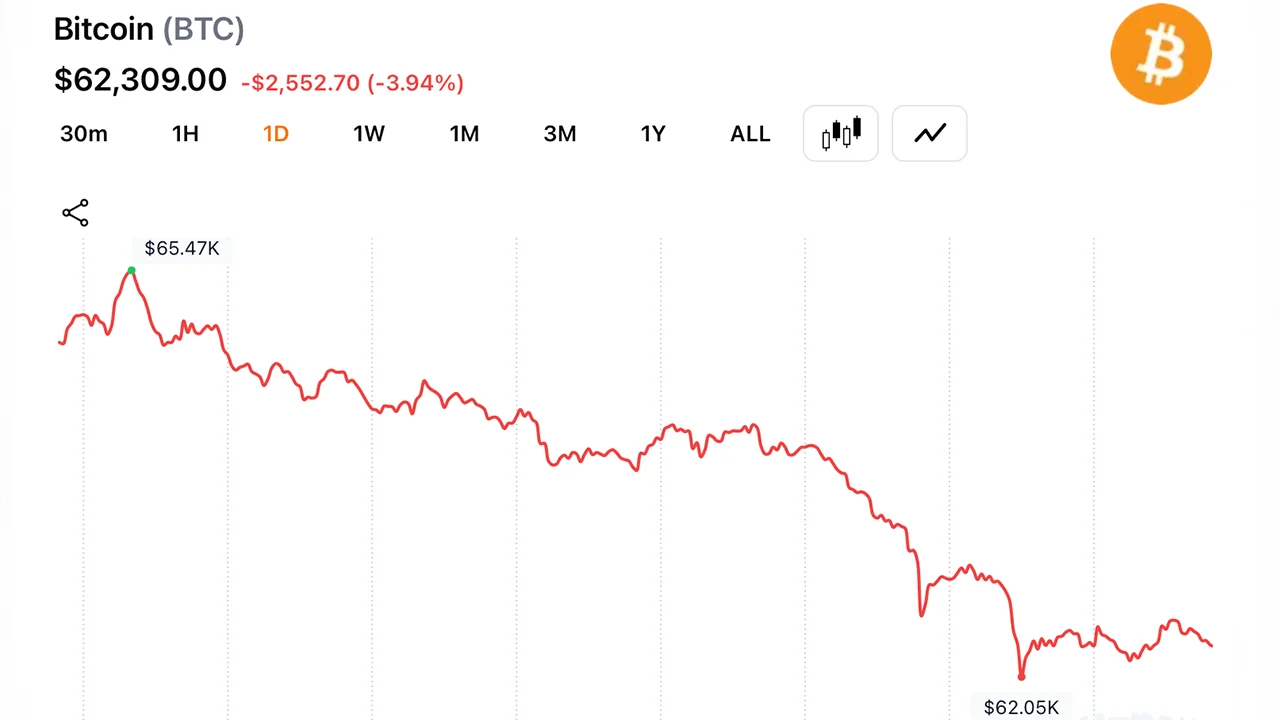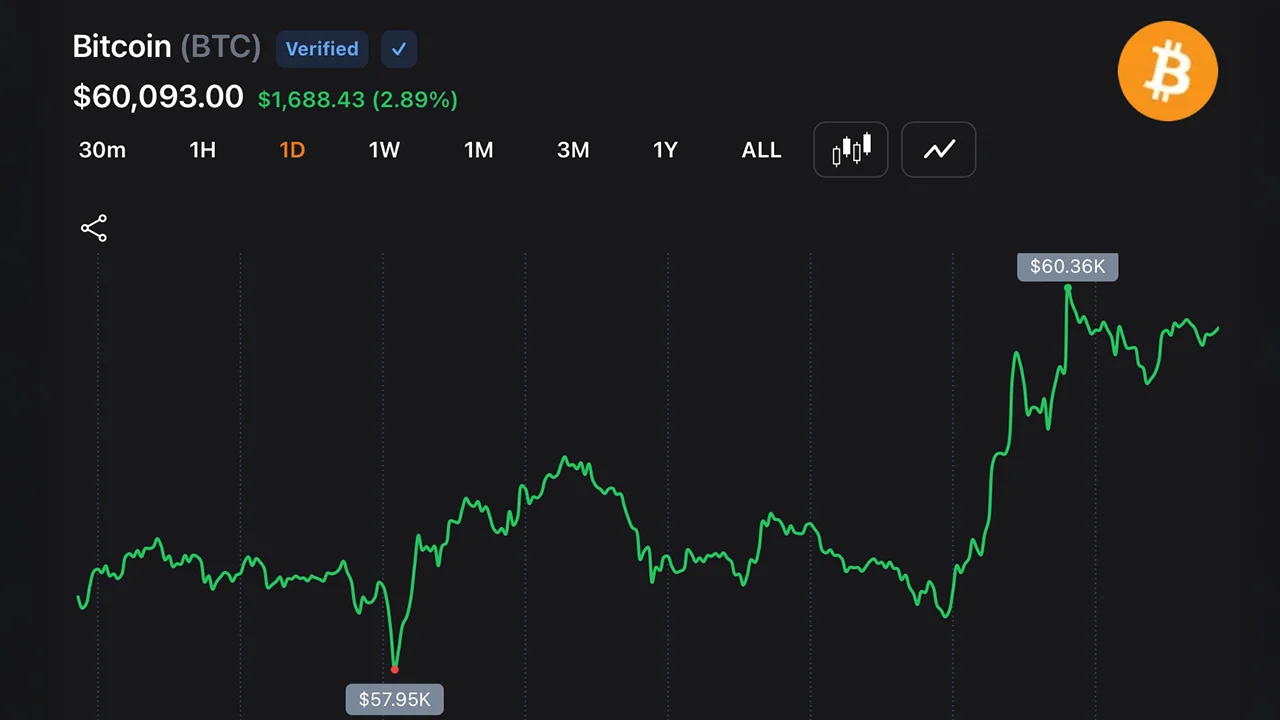
The bounce follows a pullback that traders have been calling the June selloff, with bitcoin recovering off a low near $57,735 and pushing back toward the $61,000 mark. Trading volume over the past 24 hours reached $44.052 billion, and bitcoin’s market capitalization stood at $1.227 trillion.
The recovery has been steady rather than sharp, with buyers stepping in at each dip rather than forcing a single violent move higher.
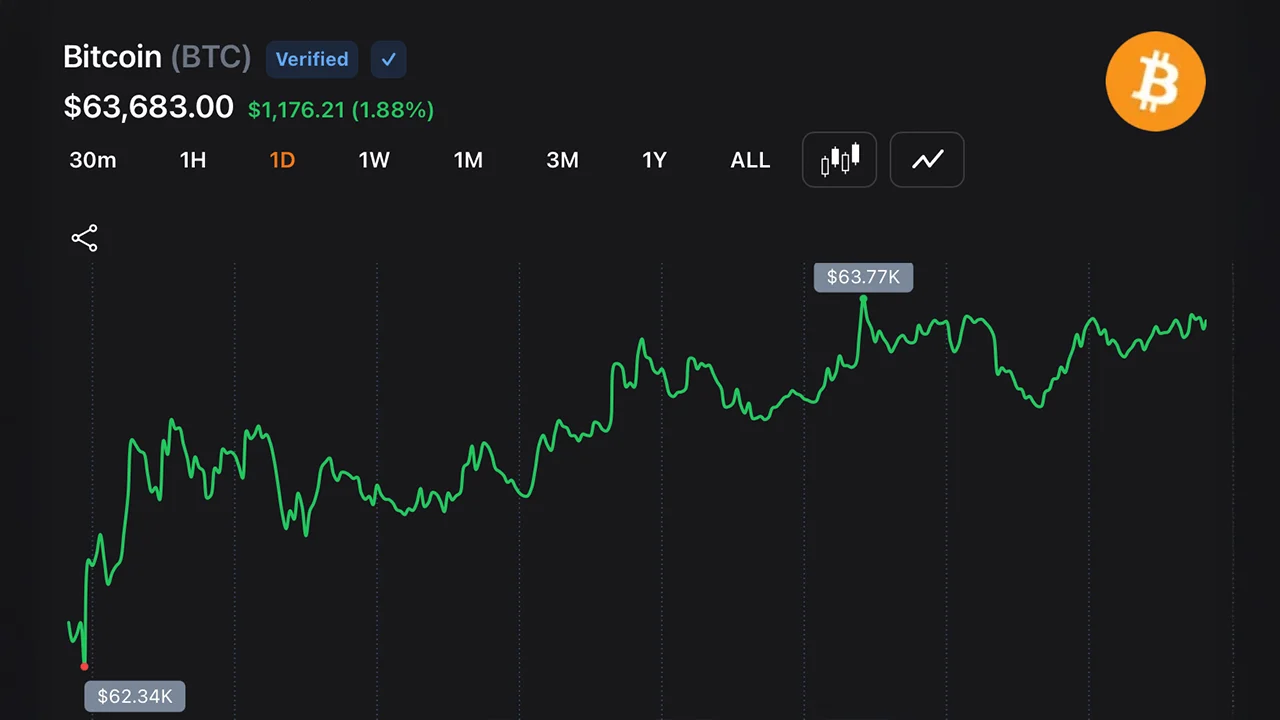
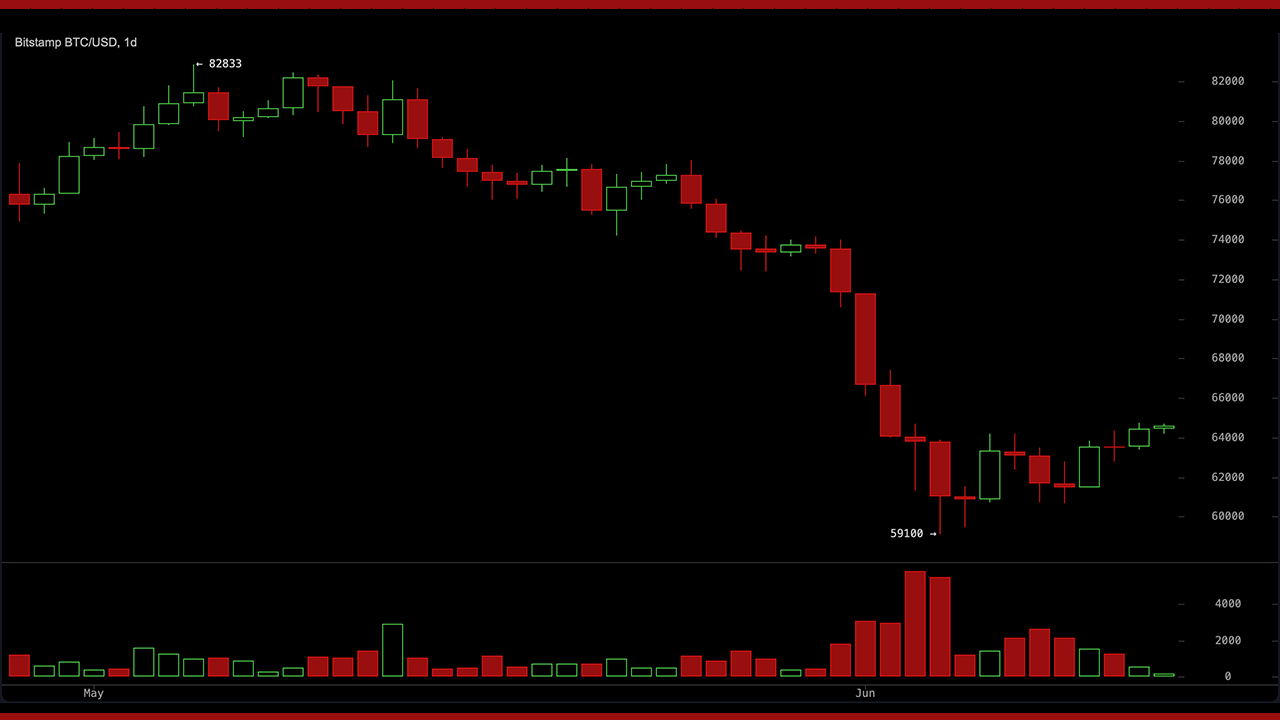
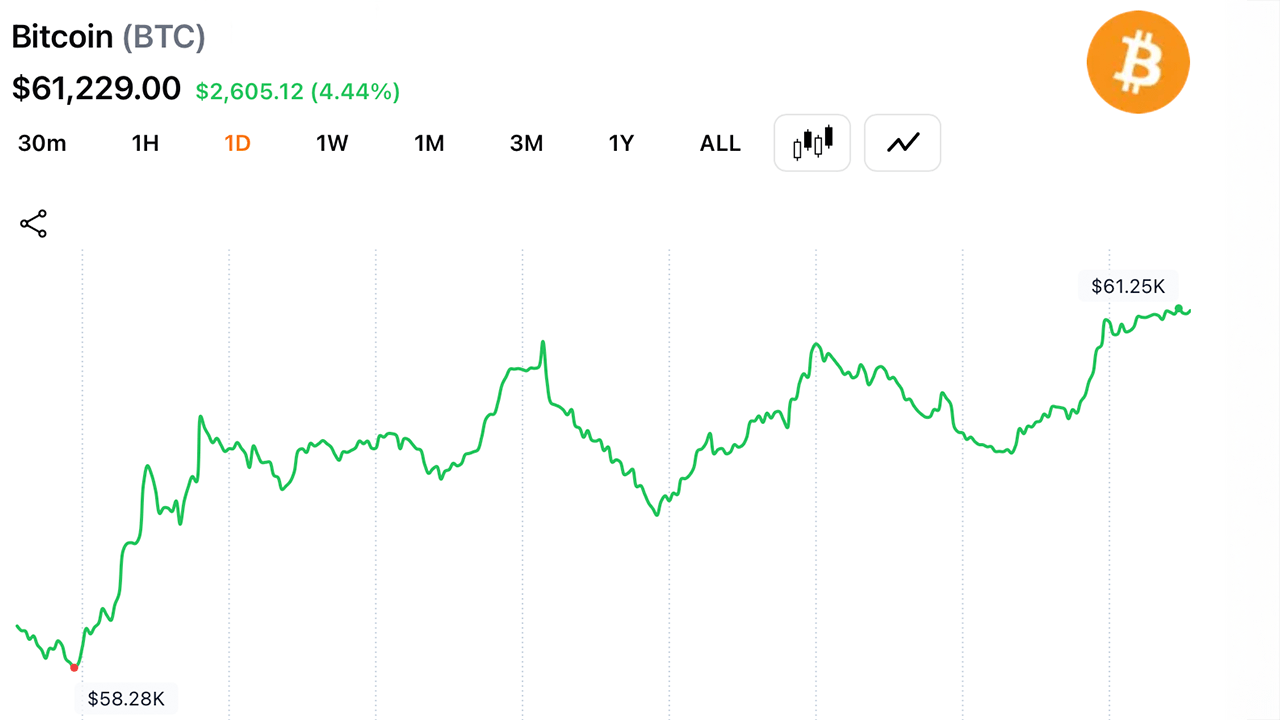
The daily chart shows bitcoin forming a higher low off the $57.7k area, a signal that buyers stepped in before price could revisit June’s floor. Support sits at $59.5k to $60k, then $57.7k below that.
Resistance runs from $61.3k to $62k, with a second wall at $64k. Recent daily candles have closed green, suggesting buyers are regaining ground, though the broader daily trend has not fully reversed. A daily close above $61.3k to $62k would strengthen the case for a continued move higher.
The 4-hour chart carries the most bullish structure among the three timeframes tracked. Price has built a run of higher highs and higher lows since bouncing off $57.7k, and the latest candles are pressing directly into resistance near $61.3k.