In brief
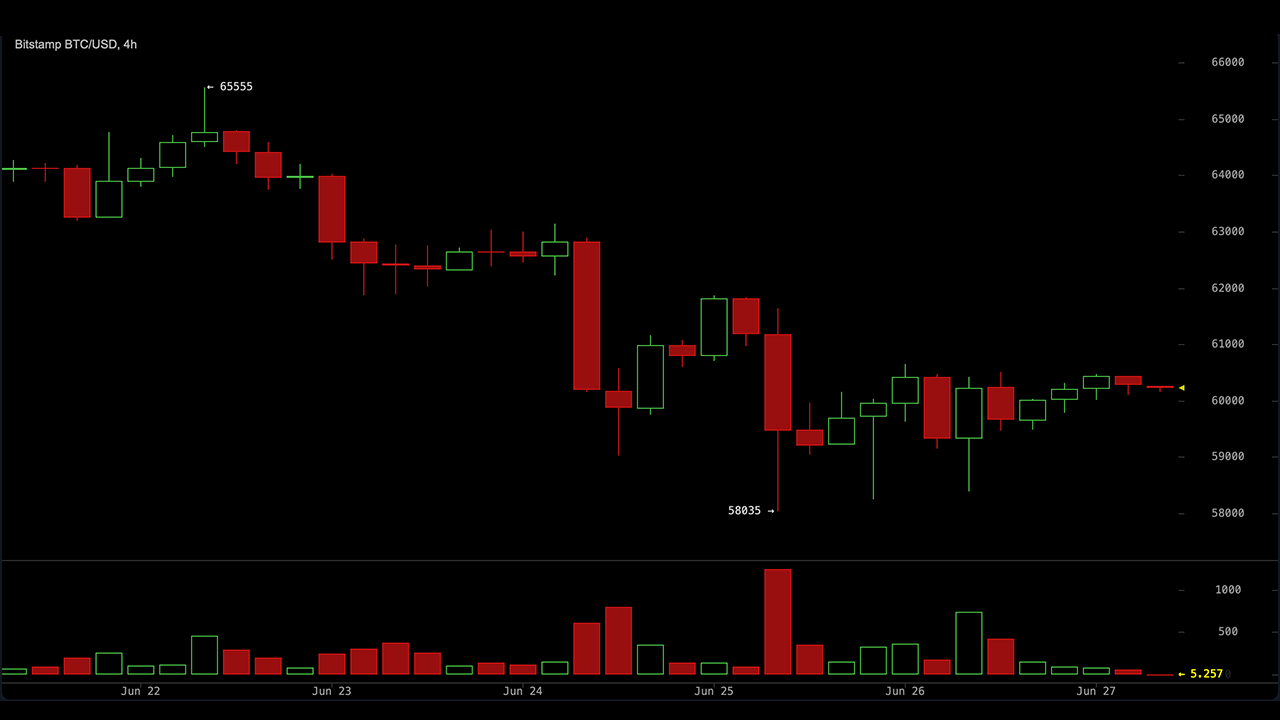
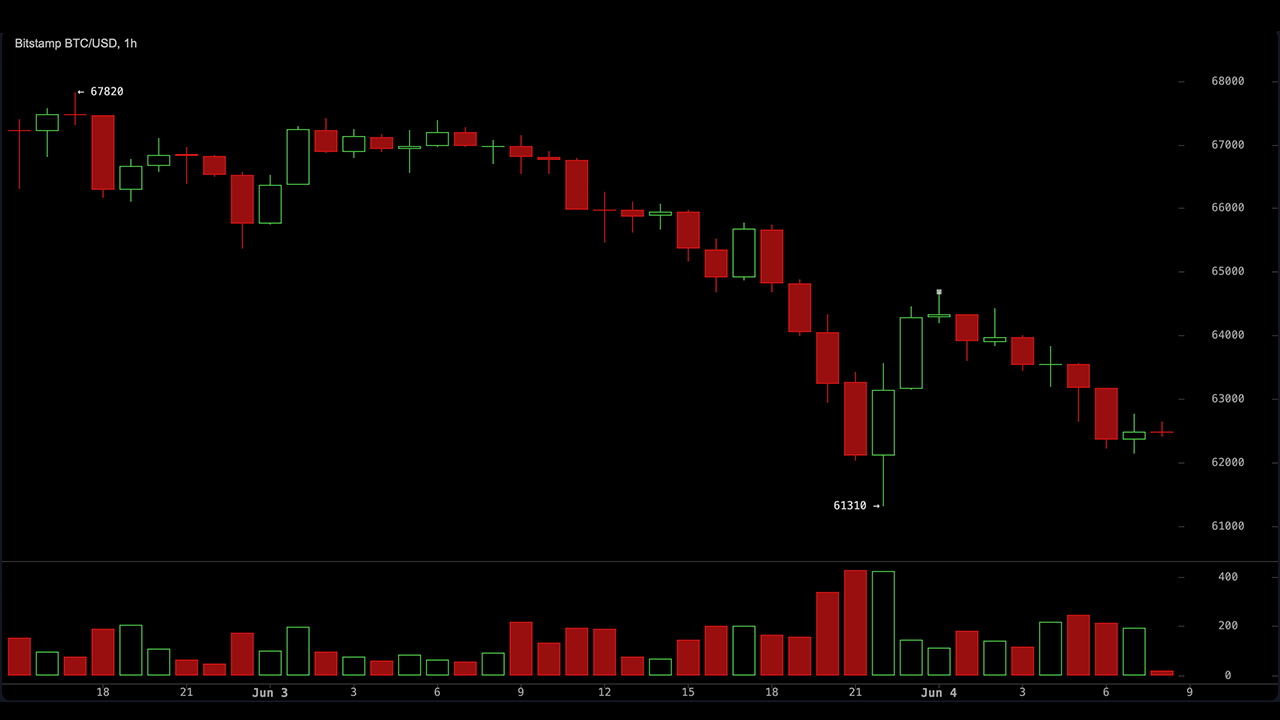
The Bitcoin daily price chart shows an RSI of 34, ADX of 36.9 trending bearish, a death-cross EMA setup, showing an organized decline.
The $58,035 support level held on Monday's intra-day dip to $58,801. It may not get many more chances.
On Myriad, traders say there's an 80% Bitcoin price dumps before any market rebound.
Wall Street turned green today—Nasdaq up 1.4%, S&P 500 up 0.8%—after the Supreme Court blocked Trump's attempt to fire Federal Reserve governor Lisa Cook and a U.S.-Iran ceasefire reduced tensions near the Strait of Hormuz.Risk assets rallied, but Bitcoin barely noticed. BTC is down roughly 53% from its October 2025 all-time high of $126,198 and just logged back-to-back quarterly losses resembling the 2022 bear market.Bitcoin price data. Image: TradingviewThe macro backdrop isn't helping. Spot Bitcoin ETFs bled roughly $4 billion in June, stripping away the institutional bid that had cushioned earlier drawdowns. The Fed under Kevin Warsh remains hawkish—markets are pricing an 80% chance of a December rate hike.Bitcoin price: What the daily chart is telling usBitcoin opened Monday at $59,473 on the daily chart, dipped to a session low of $58,801, then recovered to trade around $60,104—a +1.06% move.That bounce wasn't random. The $58,035 level is the anchor of the entire bearish Fibonacci leg measured from the June high of $67,253, and it's been holding as a horizontal support line. Bulls stepped in near it today. The question is how many times they can keep doing that.Bitcoin price data. Image: TradingviewThe Average Directional Index, or ADX, reads 36.9 on the daily. ADX measures how strong a trend is—direction aside—and anything above 25 signals a genuine, committed trend is in place.The RSI—the Relative Strength Index, which gauges buying and selling momentum on a 0 to 100 scale—sits at 34 on the daily. That's in bear territory, just above the 30 level that typically marks oversold conditions. An oversold reading can attract bargain hunters and spark a relief bounce, but at 34, Bitcoin hasn't hit that floor yet. The pressure is clearly downward.The exponential moving average picture is uniformly bearish. The 50-day exponential moving average, or EMA, sits around $66,913—well above the current price, acting as overhead resistance. The 200-day EMA is even higher at approximately $76,517. When price trades below both moving averages with the 50 also below the 200—a configuration traders call a death cross—it signals the medium- and long-term trends are both pointing down. That's exactly what the daily chart is showing right now.The bigger picture is harder to ignore. On Myriad, a prediction market created by Decrypt’s parent company Dastan, traders are pricing in an 80% chance Bitcoin dumps to $55K as opposed to pumping back to $84K.Not great news for the permabullish crew.Overall, considering Bitcoin is in a compression zone, the four-hour chart may seem a bit more interesting for traders with shorter time horizons. The price of Bitcoin has been compressing between roughly $59,200 and $60,400, and the Squeeze is still “on” at that timeframe with barely positive momentum (+0.26).Bitcoin price data. Image: TradingviewAnd this makes prices predictable as long as the compression remains. With 5x leverage, each round trip on that $1,200 band yields approximately 21.1% on reinvested capital—turning $1,000 into close to $2,000 over a few cycles with manageable risk. That's the trade while the compression holds. A break below $59,200 kills it immediately.If $58,035 breaks, the daily chart offers no meaningful support until the $55,528 priceline —pretty close to the Myriad doom scenario. For the bulls, the first real target on any recovery is the Fibonacci Golden Zone between $62,644 and $63,732 on the daily, which would need to be reclaimed to even start talking about a trend reversal.Above that sits the descending trendline around $65,000. Clear both, and the 50-day EMA at $66,913 comes into view—a level Bitcoin hasn't traded near in over a month.DisclaimerThe views and opinions expressed by the author are for informational purposes only and do not constitute financial, investment, or other advice.Daily Debrief NewsletterStart every day with the top news stories right now, plus original features, a podcast, videos and more.