Rocket Lab stock is showing notable weakness. What’s behind RKLB decline?
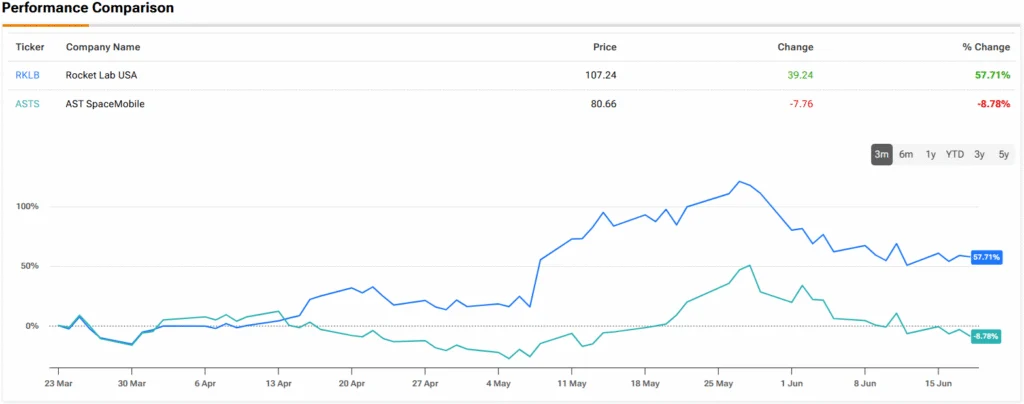
What Is Rocket Lab’s Current Support Level?With markets open, the broader backdrop is constructive: the Dow Jones is up 1.25%, the Nasdaq is up 0.37%, and market breadth is positive with a 1.8 advance/decline ratio. Rocket Lab’s drop while its sector leads suggests the tape is being dominated by profit-taking and technical re-pricing after the May peak rather than a sector-wide hit.Rocket Lab Stock: Key Technical Levels To WatchThe bigger-picture trend is still constructive, but the stock is in a cooling phase: it’s up 151.34% over the past 12 months and remains above its 200-day SMA ($74.70), yet it’s trading 26.7% below its 20-day SMA ($110.86) and 23% below its 50-day SMA ($105.60). That combination often reads as "long-term uptrend, short-term downtrend," where rallies can get sold until price starts reclaiming shorter moving averages.MACD is the cleaner momentum lens right now: it’s below its signal line with a negative histogram, which typically means upside pressure is fading versus the prior upswing unless buyers can reassert control. In plain English, MACD vs. its signal line helps gauge whether momentum is building or cooling, and right now it’s leaning toward cooling.The $78 area highlighted in the chart discussion sits close to current trading and lines up with the idea of a nearby "decision zone," while the broader 52-week context shows how far the stock has already traveled (high $151.00 in May, low $31.78). From a level-to-level perspective, bulls generally want to see stabilization above the mid-$70s and then progress back toward the low-$90s before the moving averages overhead become the next test.