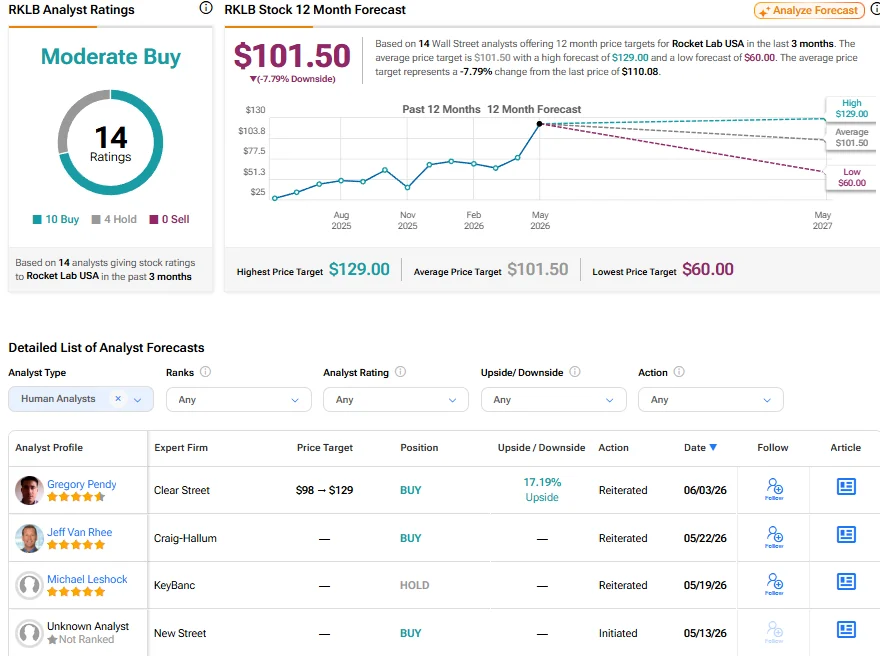
Rocket Lab stock is feeling bearish pressure. What’s pressuring RKLB stock?
Rocket Lab Stock ReversesRocket Lab stock found itself on the wrong side of that tape Monday, sliding more than 13% even as the Nasdaq managed to stay up 0.21% and the S&P 500 slipped just 0.04%. The stock appears to be caught up in a broader pullback in space-related names following a strong run. The message from traders is simple: in a session where mega-cap tech can still play defense, smaller-cap rockets get sold first and questions get asked later—especially after a 436% 12-month surge that leaves plenty of fast money sitting on gains.That's the key tension in RKLB right now. The long-term "space buildout" narrative is still getting capital, helped along by space ETF inflows. But on days when breadth collapses, the market treats momentum leaders like inventory, not investments.Defense Milestone Keeps The Fundamental Floor In ViewSo the stock is caught between two forces: a real, compounding defense footprint on one side, and a market that's currently punishing anything that looks like "high-beta momentum" on the other. The next question becomes whether the chart can absorb the volatility without turning a pullback into a full-blown unwind.The Trend Is Still Up But This Level Is KeyEven after Monday's slide, the longer-term structure still looks bullish. RKLB is trading about 79.7% above its 200-day SMA ($69.12) and 47.6% above its 100-day SMA ($84.13). The shorter-term setup remains constructive too: the 20-day SMA ($118.09) is above the 50-day SMA ($91.25), and the 50-day SMA is above the 200-day SMA — classic "trend up, pullbacks happen" positioning.Where it gets more tactical is the stock's behavior after May's peak, which also marked the 52-week high at $151.00. A decisive reclaim of that level would reassert trend control. Failure to stabilize, though, risks turning this into a deeper mean-reversion move toward faster moving averages—less "healthy dip," more "momentum reset."MACD offers a cleaner read on whether the selling is losing steam: it's above its signal line and the histogram is positive, suggesting downside pressure is easing versus the prior downswing even if price remains choppy. Translation: the stock may be wobbling, but momentum isn't waving a white flag yet.