The technology sector is experiencing an unprecedented "rare surge" as the semiconductor SOX index flashes urgent warning signs of "extreme volatility" matching the 2000 Dot-Com Bubble, raising questions among investors about a potential market peak.
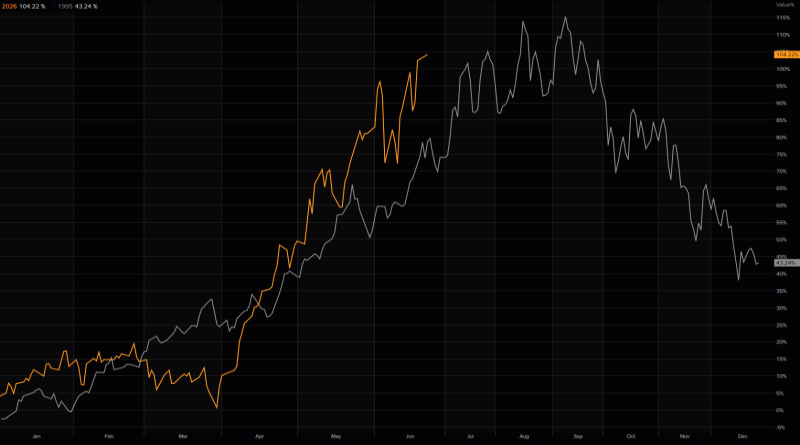
Unprecedented Fluctuations In The $SOX Index According to data presented in the chart shared by Kobeissi Letter, the semiconductor index has logged nine single-day gains of at least +5% over the past 60 trading days.
This matches levels last seen in January 2009.
Historically, this precise reading has only been exceeded during the infamous 2000 Dot-Com Bubble burst, a period where the metric peaked at 17 sessions in January 2003 and 15 days in early 2001.
Here are those nine dates over the last 60 days when the index logged a gain of close to 5%: Nine DatePrevious CloseCurrent CloseDaily % ChangeMay 6, 202610,980.5811,472.75+4.48% (Near Miss)May 8, 202611,160.9911,775.50+5.51%May 20, 202611,305.5011,813.29+4.49% (Near Miss)May 26, 202612,202.5412,876.91+5.53%Jun 2, 202612,965.6513,726.27+5.87%Jun 8, 202612,220.7612,906.69+5.61%Jun 11, 202612,206.4613,171.44+7.91%Jun 15, 202613,371.4714,099.62+5.45%Jun 18, 202613,477.0714,341.78+6.42% Read Also: Tom Lee Identifies 4 Catalysts That Could End The Historic AI Semiconductor Rally Volatility Reserved For Major Bear Markets This aggressive clustering of massive single-day gains is highly unusual for a sustainable bull market.