I picked up a random dataset of amazon book sales of 10 years from kaggle and started exploring and analysing it.
1.Data Cleaning
At first I opened my dataset in power query and found there were many duplicate values in my book name section then I removed the duplicates.Then I found in the price section there was some 0 values so the price of book can't be zero so I took the mean of the price array and replaced all zeroes with mean to make my analysis better and then I loaded my data and started to analyse it.
2.Data Analysing
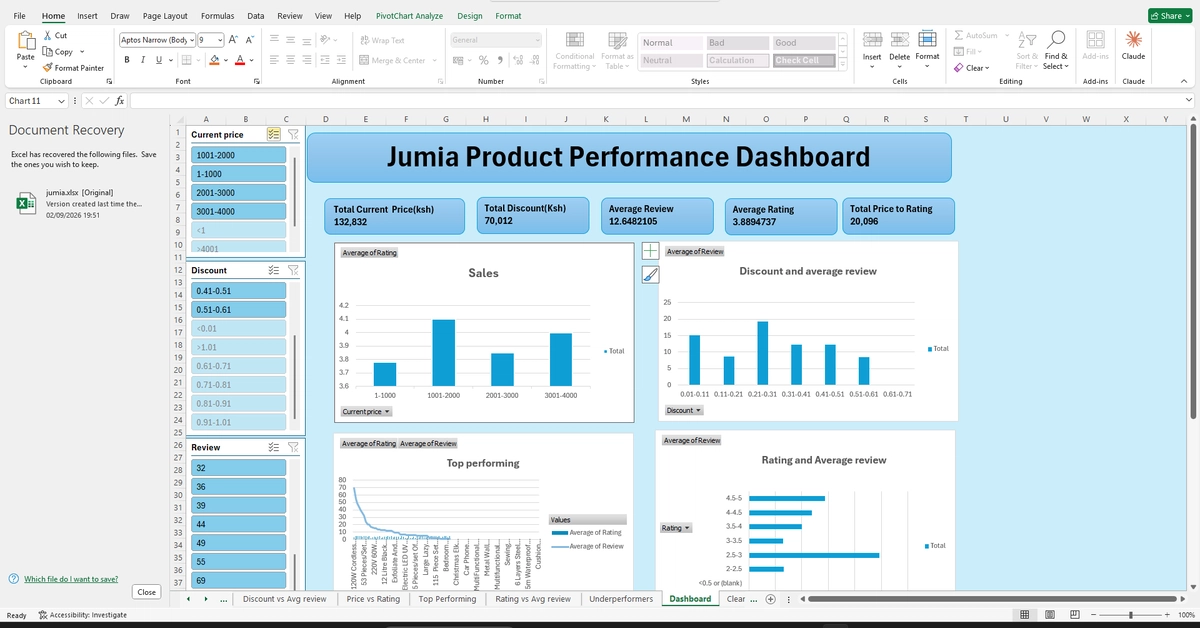
I did various analysis using pivot tables and some excel function.