Support CleanTechnica's work through a Substack subscription or on Stripe.
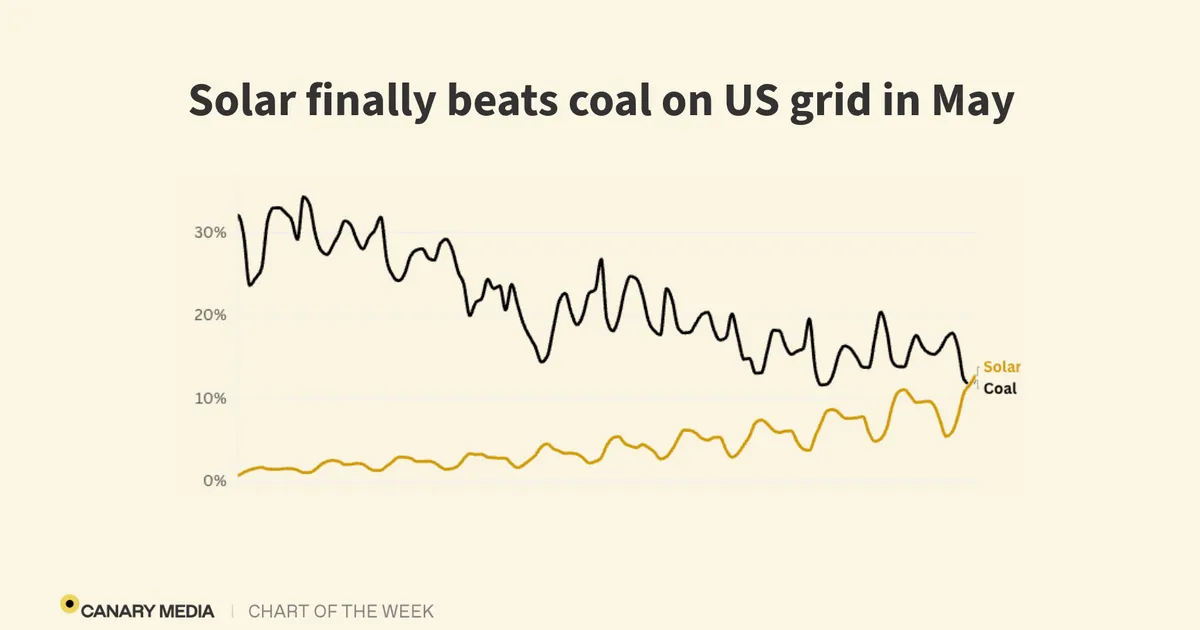
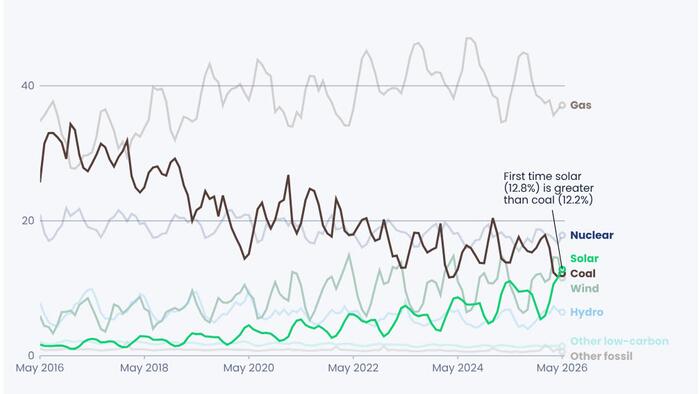
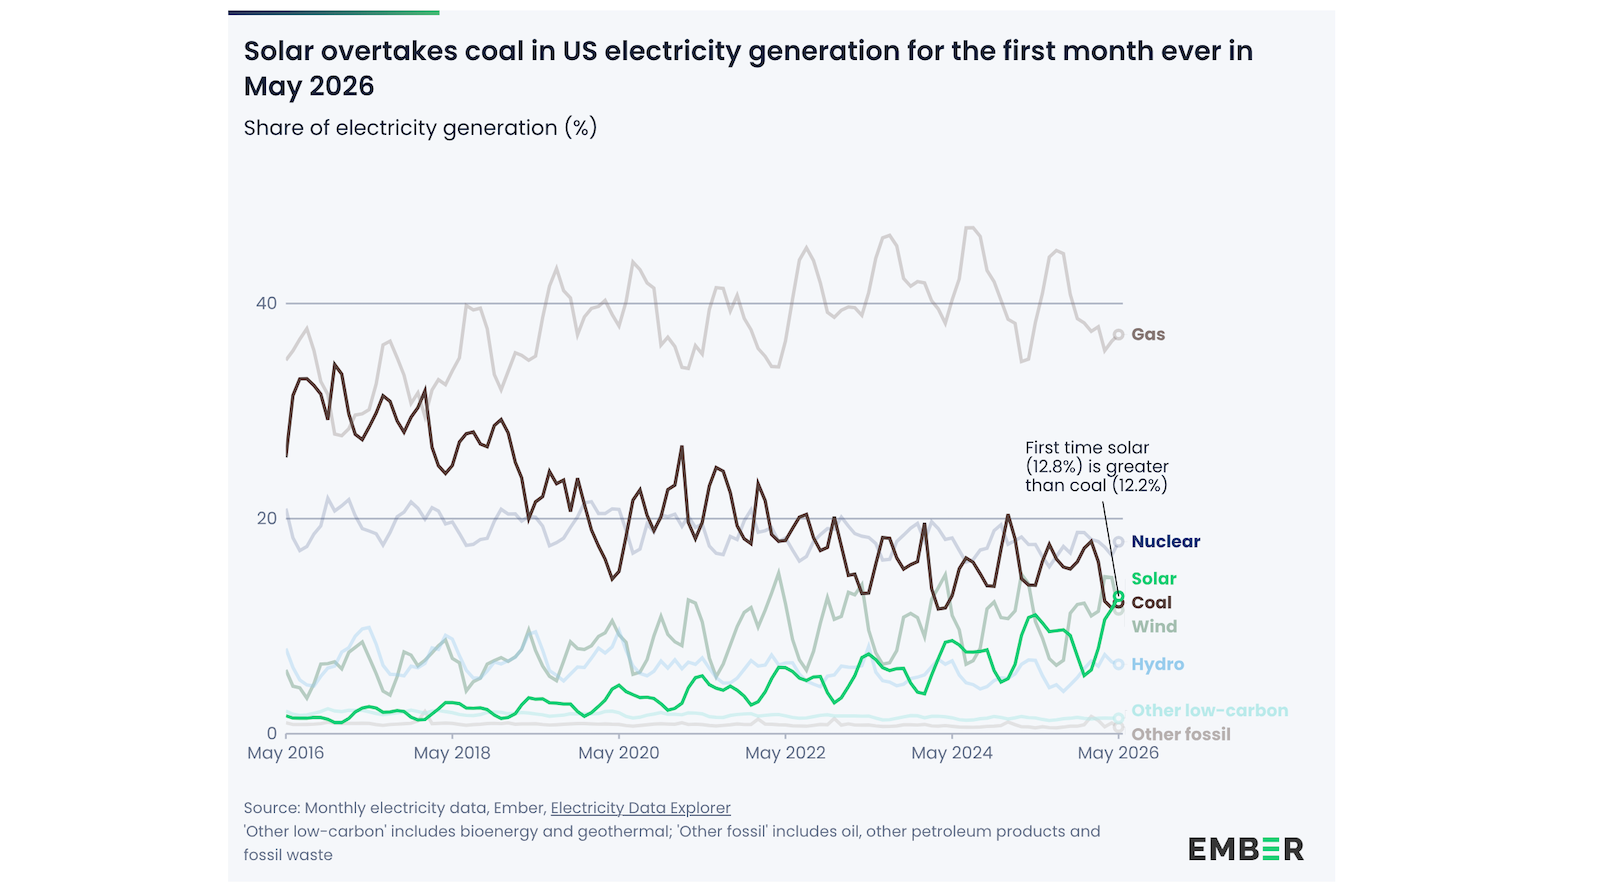
We briefly covered the news this month that electricity from solar power surpassed electricity from coal power in May. This is the first time the US ever got more electricity from solar than from coal across a full month. But let’s take a closer look, also sharing a great graph created by Ember.
For those of you who read CleanTechnica 10–15 years ago, you may remember the monthly US electricity generation and capacity reports I created back then. It was always fun seeing the growth of wind and solar power, which eventually came to absolutely dominate new power capacity in the country. However, change in electricity generation was so slow, and electricity from solar power was so tiny. But the trends were clear, and they would only lead one way. Now, we can see that solar has passed that historic marker of creating more electricity for the country than coal. Solar provided 12.8% of the US total, while coal provided 12.2%.
As the graph below shows, coal power has declined for years as it has gotten less and less competitive. At the same time, solar power has risen for years. There are clear seasonal variations, so we can expect coal to generate more electricity than solar again later in the year, but for the next few months or so, solar electricity should exceed coal electricity. In fact, it’s also climbing close to nuclear electricity!