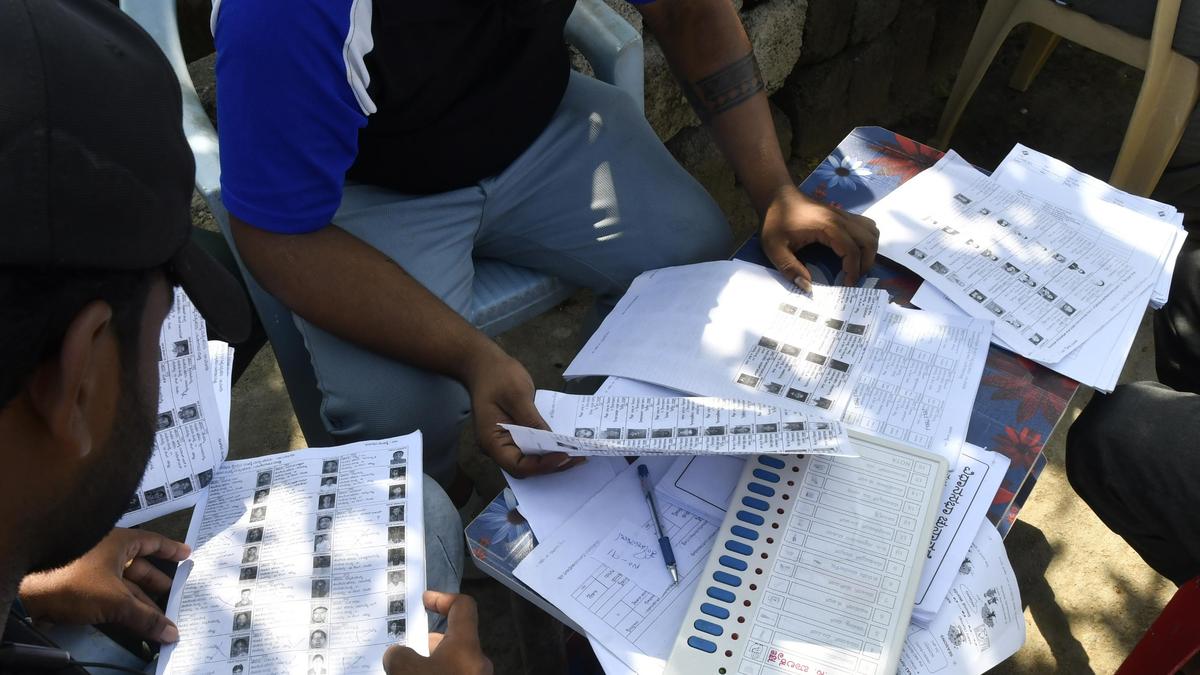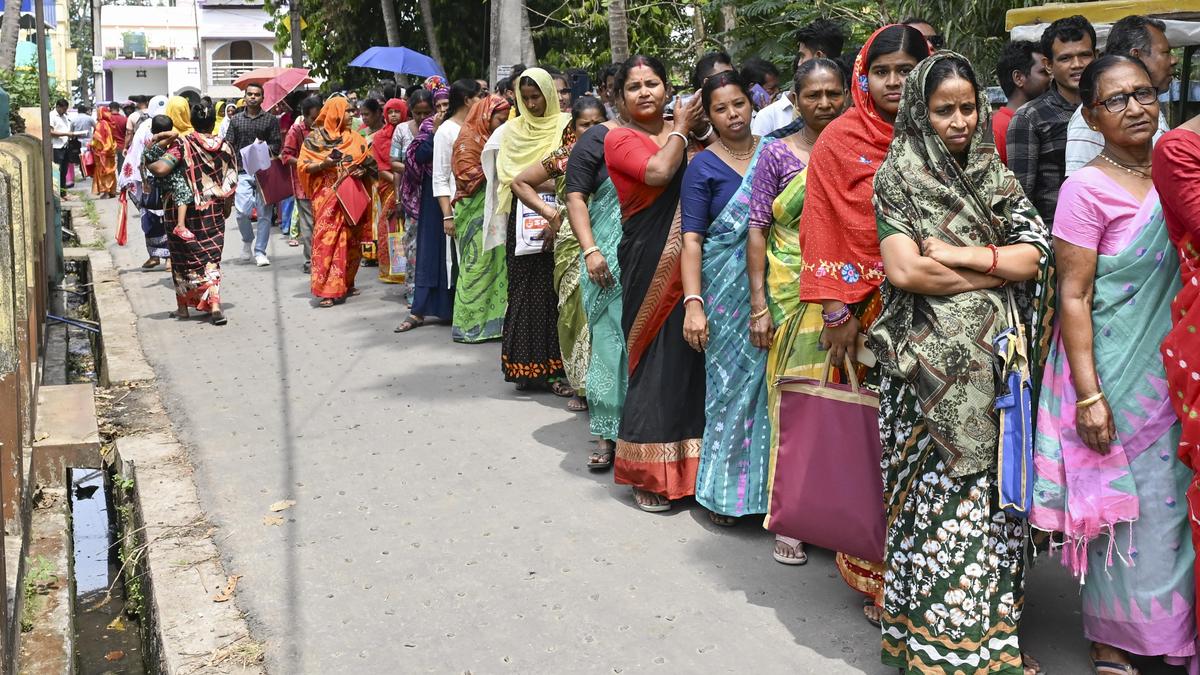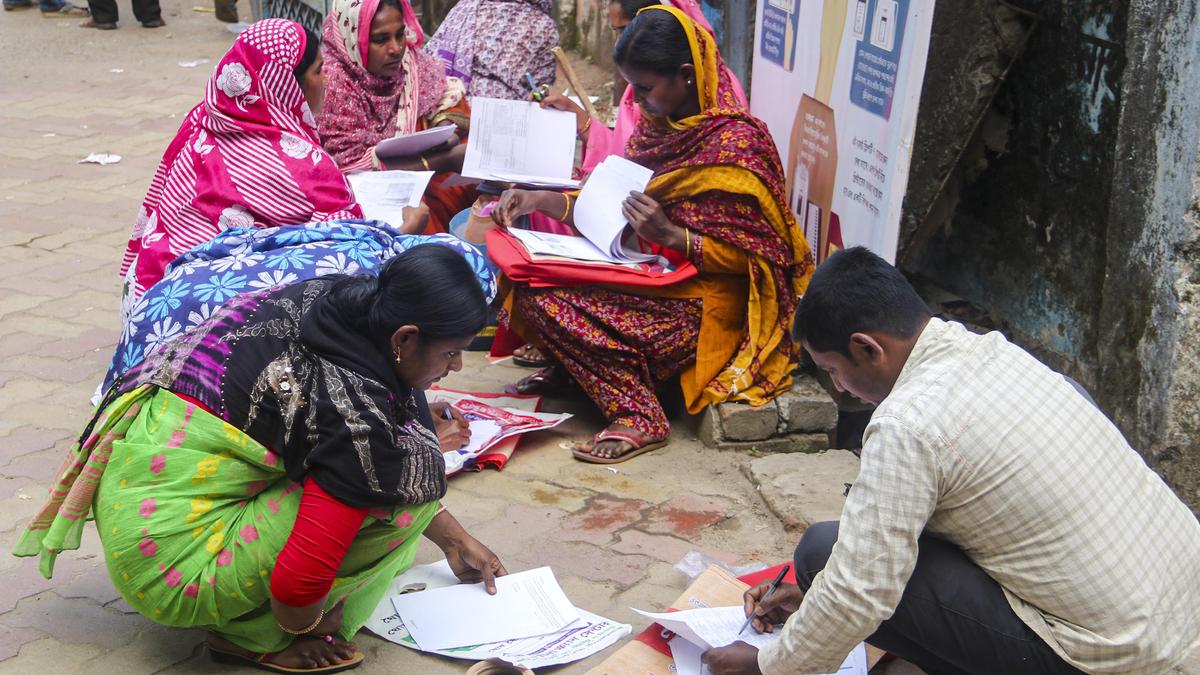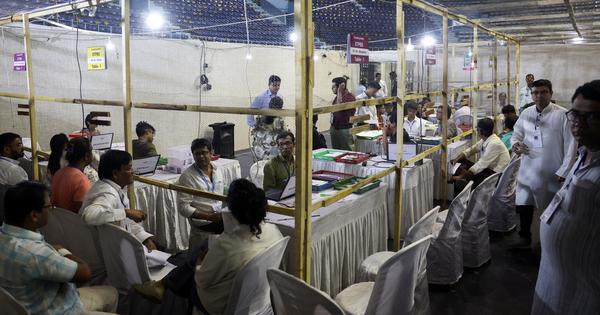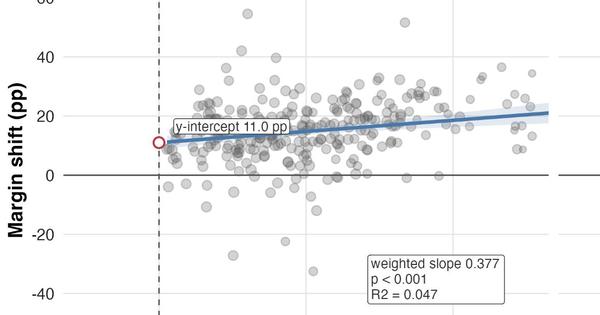
From November to February, more than nine million names were deleted from the Bengal electoral rolls in the space as part of what the Election Commission of India calls a Special Intensive Revision.This was followed by a shock landslide win by the Bharatiya Janata Party on May 4, where the Hindutva party won 70% of the seats in the Assembly.In this piece, we use statistical methods to examine whether SIR deletions were associated with electoral outcomes. We also build a simple model to try and quantify the extent of the impact.Our analysis shows a strong relationship between SIR deletions and electoral performance in Bengal: constituencies where the electoral roll shrank more also saw the BJP do better relative to its main challenger, the Trinamool Congress. Notably, a comparable exercise in Bihar, which also underwent an SIR, shows no equivalent pro-ruling alliance pattern linked to roll shrinkage.Our methodWe seek to find the relationship between voters deleted during the SIR and the relative performance of the BJP and Trinamool: the two main players in this election.This approach differs from much of the existing discussion, which compares the number of deleted voters with the final winning margin. In our view, that arithmetic misses how rolls actually shape elections. Roll deletion does not merely subtract names from a list. It can change the composition of the electorate that remains, the balance of local coalitions and the signals voters and parties read about who is strong.The better test, then, is whether roll shrinkage was systematically associated with changes in party margins.To do this, we must understand the relationship between roll shrinkage and the relative electoral performance of the BJP vis a vis the Trinamool, using Assembly constituency level data.In West Bengal, “all-cause” roll shrinkage is measured as the percentage fall in total electors from the 2024 Lok Sabha divided by assembly segments to the final post-SIR roll before the 2026 Assembly election. For example, in Kolkata’s Bhabanipur assembly constituency, the number of electors shrank from 2,05,553 in the 2024 general election to 1,60,313 in the final post-SIR roll before the 2026 election – a roll shrinkage of 22%. “All-cause” means the total fall in registered electors, whatever reason was recorded for deletion. It includes valid removals like deaths, migration, duplicates but can also include erroneous removals of eligible citizens. It is, therefore, simply a measure of how much the formal electorate contracted over the administrative exercise.What we are tracking is the relative change in the electoral performance of the BJP vis-a-vis the Trinamool from 2021 to 2026. We measure this as the change in the BJP minus Trinamool vote share from 2021 to 2026. If it becomes less negative or more positive, the constituency has shifted toward the BJP relative to the TMC.For example, in Bhabanipur, the BJP received 35.2% of the vote in 2021 and the Trinamool received 57.7%, giving the BJP a margin of −22.5 percentage points. In 2026, the BJP received 53.0% and the Trinamool received 42.2%, a margin of +10.8 points. The constituency thus moved 33.3 percentage points toward the BJP relative to the Trinamool.We replicate the same logic for Bihar, another state where parties raised concerns about the SIR process. There, all-cause roll shrinkage compares the 2024 Lok Sabha elector count divided by assembly segments with the 2025 Assembly elector count. The electoral outcome is the change in the BJP-led National Democratic Alliance minus the opposition Mahagathbandhan margin between the 2020 and 2025 Assembly elections. Because Bihar’s alliances changed over this period, we rebuilt National Democratic Alliance and Mahagathbandhan vote shares from party-level results separately for each year, using year-specific alliance membership.The data cannot establish intent behind deletions, nor show how deleted voters would have voted, but they can tell us whether the geography of roll shrinkage lined up with the geography of electoral change.What the data showsThe first difference between Bengal and Bihar is the scale of deletions (see Figure 1).In West Bengal, the median constituency saw roll shrinkage of 9.6% – which means half the constituencies had lower shrinkage and half had higher shrinkage.Bihar’s median, on the other hand, was only 3.0%. Positive values mean the electoral roll got smaller. This does not prove that any particular deletion was improper. It just shows that Bengal’s contraction was much larger – all the more stark given that the West Bengal election was a year later, and the rolls should have gained an extra year of newly registered voters.Figure 1: Distribution of roll shrinkage in West Bengal and Bihar. The figure shows a histogram where the x-axis shows the percentage fall in registered electors from the 2024 Lok Sabha assembly-segment roll to the later Assembly roll; positive values mean the roll got smaller. The y-axis is a density scale, so the bars show where constituencies are concentrated rather than raw counts. This allows the distributions in the two states to be compared directly. The orange line marks the median constituency shrinkage.To estimate the relationship between all-cause roll shrinkage and electoral outcomes, we use a vote-weighted linear regression – constituencies with more voters count more in estimating the line, since a margin shift there involves more people. In practice, the weighting makes little difference.In West Bengal, there is a noticeable relationship between SIR’s roll shrinkage and electoral outcomes: each percentage point of roll shrinkage is associated with a 0.377 percentage-point shift in the BJP-Trinamool margin toward the BJP (see Figure 2). A constituency moving from 0 to ten percent roll shrinkage would thus be associated with roughly a 3.8 point movement toward the BJP and away from the Trinamool.In contrast, Bihar shows no equivalent pro-National Development Alliance pattern – the weighted slope is in fact negative.The West Bengal relationship is statistically strong. Bihar’s relationship is weaker and not statistically significant (the p-value is typically expected to be less than 0.05 for statistical significance). The Bihar comparison matters because it rules out one easy explanation. If roll shrinkage mechanically produced a pro-ruling-party swing wherever it occurred, Bihar should show the same pattern. It does not. The Bengal result remains an association rather than proof of causality but the Bihar comparison makes it harder to dismiss the pattern as a statistical accident.Figure 2: Vote-weighted relationship between roll shrinkage and margin shift. Each point is an Assembly constituency. The x-axis shows roll shrinkage or net deletions rate, in per cent. The y-axis shows the change in the BJP-minus-TMC margin in West Bengal and the NDA-minus-MGB margin in Bihar, in percentage points; positive values mean the BJP margin improved in West Bengal and the NDA margin improved in Bihar. Lines are weighted by valid votes in the later Assembly election.We then break down the deletion data because all-cause shrinkage is deliberately broad. Table 1 asks whether the association appears only in that broad measure, or also when we use the official deletion categories.Non-death deletions are removals not recorded as deaths. The distinction matters because death deletion is routine roll correction, while non-death deletion is where questions of residence, shifting, duplication, documentation or error are more likely to arise. The data also contains an ASDD-labelled category – voters marked “absent, shifted, dead or duplicate”. Because deaths are reported separately, we treat ASDD as an official category, not as proof of why any one voter was removed. Finally, supplementary-list deletions are those made right at the end, including through the controversial "logical discrepancy" protocol. To make these measures comparable across constituencies, each count is divided by the constituency's 2024 elector total.The narrower measures point in the same direction as the broad one. Non-death deletions, ASDD deletions and supplementary-list deletions are all positively associated with a BJP-favourable margin shift.This does not identify wrongful deletions. It shows the Bengal pattern is not driven by one broad variable – it persists when the deletion file is broken into narrower categories.
Data analysis: How SIR deletions shaped BJP’s landslide in Bengal
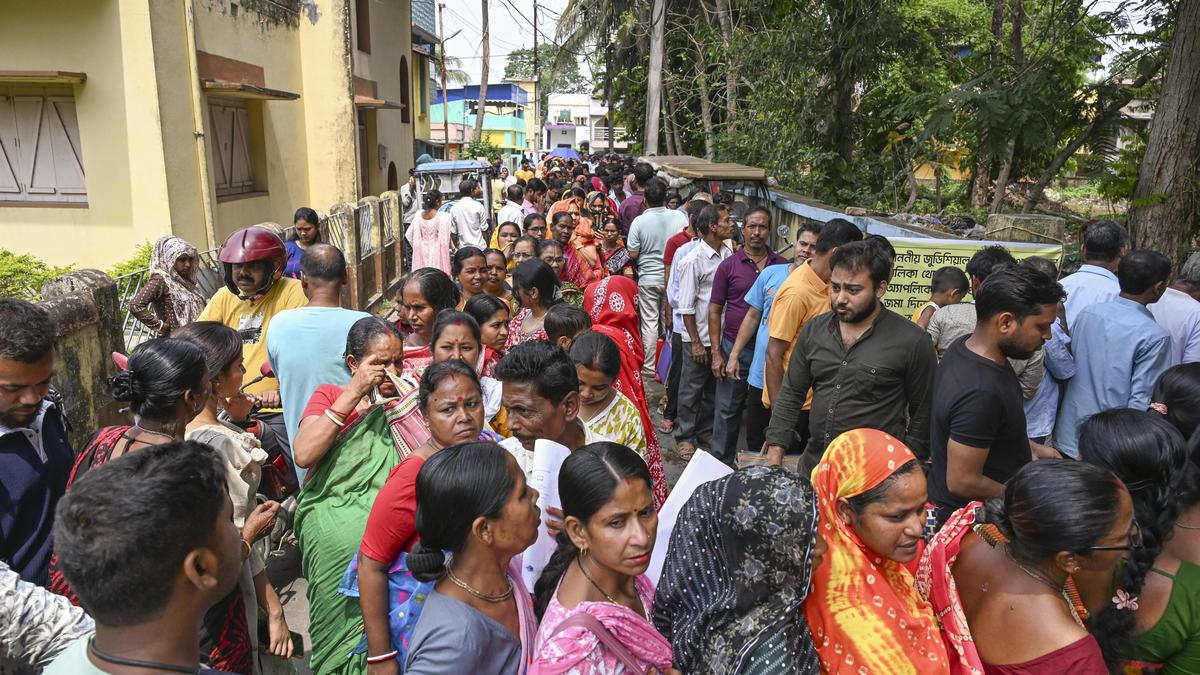
In Bengal, constituencies where the roll contracted more in the SIR tended to move further toward the BJP relative to the TMC.
2,570 words~12 min read