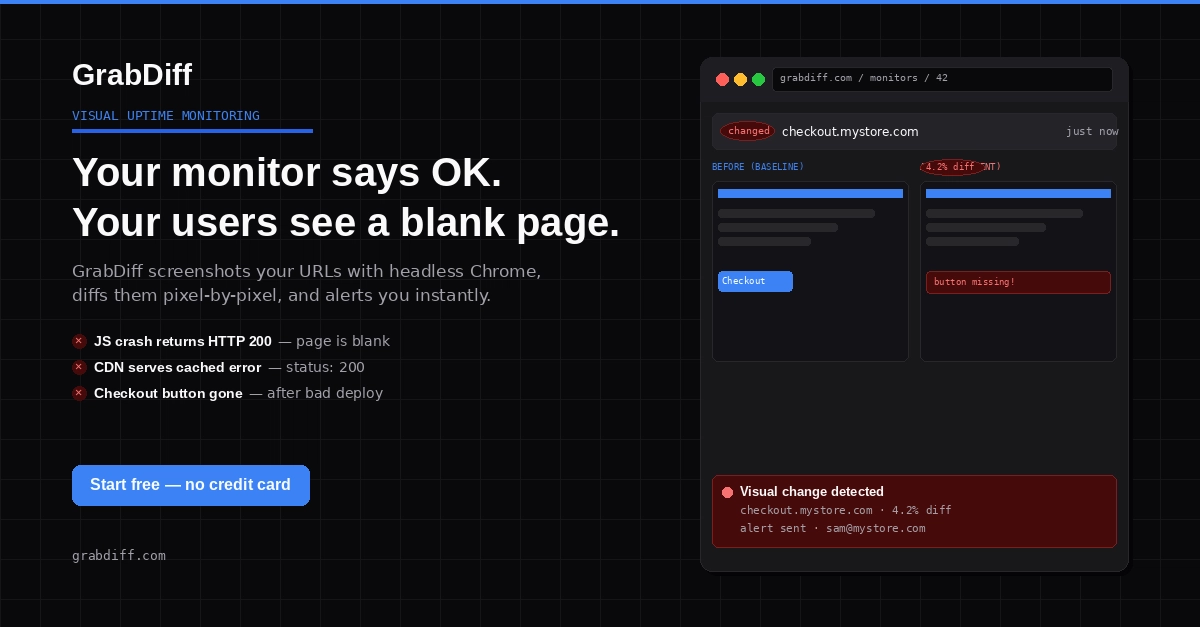
Most uptime monitors answer one question: is it up or down? But some of the worst incidents I've dealt with returned a perfectly happy 200 OK:
an endpoint that started serving a cached error page
a JSON API returning {"error": ...} with status 200
a response that quietly got 10× slower
a payload that dropped from 14 KB to 800 bytes because a backend started returning empty results. A plain up/down check sails straight past all of these. I wanted my monitor to notice "it's up, but it's wrong." Here's how I built that — and why I deliberately didn't reach for machine learning (or the word "AI").