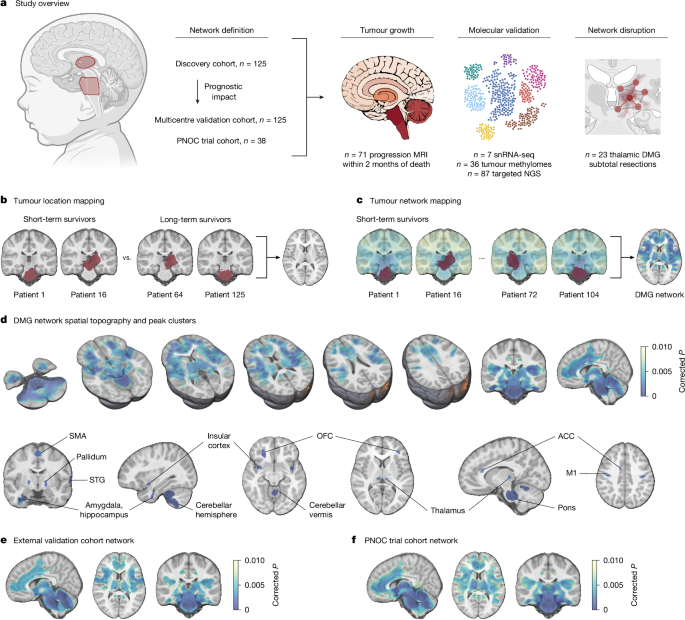
MainDiffuse intrinsic pontine glioma (DIPG) and other diffuse midline gliomas (DMGs) are the leading cause of solid-tumour-related death in children which despite clinical trials over the past two decades, retain notorious therapeutic resistance and near-universal lethality2,13. A major clinical challenge limiting the efficacy of conventional therapeutic approaches, and recognized in original definitions of the disease, is the extensive infiltration of healthy brain parenchyma14. This distributed, brain-wide pattern of tumour progression, including to distant brain regions such as the frontal and temporal poles, is insufficiently explained by current models of tumour evolution15,16,17. Recent work has established DMG integration and communication with otherwise healthy neural circuits through both paracrine signalling (brain-derived neurotrophic factor (BDNF) and neuroligin-3 (NLGN3))4,7,8 and bona fide, electrophysiologically functional neuron-to-glioma synapses across a diverse neurotransmitter repertoire, including glutamatergic, calcium-permeable AMPA receptor-mediated3,4; cholinergic M1–M3 receptor-mediated5; and GABAergic GABAA receptor-mediated6 neuron-to-glioma synapses. In animal models, depolarization of glioma cell membranes drives tumour growth through voltage-dependent mechanisms that remain to be fully elucidated3,4. Neuronal cell somata local to or distant from and projecting onto malignant cells engage brain-wide neural populations in glioma circuits, activity from which acts as a putative driver of tumour progression5,9,18. For example, long-range cholinergic projections from the midbrain pedunculopontine and laterodorsal tegmental nuclei, respectively, promote the circuit-specific growth of pontine and thalamic DMG in preclinical models5. Although the impact of other neuromodulatory neurons remains to be fully explored, early preclinical reports suggest that serotonergic projections from the dorsal and median raphe promote the circuit-specific growth of pontine, thalamic and cortical DMG, while noradrenergic projections from the locus coeruleus also promote DMG growth9,18.Thus far, attempts to map the brain-wide neural circuits implicated in tumour growth have been restricted to mouse models, which offer an incomplete representation of human-specific neurobiology and therapeutic relevance. Further, the distinct spatiotemporal pattern of DMG incidence, such that pontine and thalamic tumours peak in incidence during early childhood and early adolescence, respectively, suggests tumour exploitation of an underlying neurodevelopmental process. Here, using patient clinical data and human paediatric connectomic data, we define the spatial topography of brain network connections associated with short-term survival in children with DMG and delineate circuit-specific trajectories of DMG tumour growth.Tumour network mappingWe first studied a discovery cohort of 125 children aged less than 18 years with primary pontine DMG/DIPG (n = 106), or thalamic DMG (n = 19), treated at Great Ormond Street Hospital for Children (GOSH; Fig. 1a and Supplementary Table 1). As pontine biopsies were historically not performed19, children meeting clinical diagnostic criteria for DIPG20,21,22 and with a disease course consistent with short-term (<18-month)23 overall survival were included. In line with the World Health Organisation 2021 definition of the disease1, biopsied tumours are classified as DMG, H3K27-altered, while non-biopsied pontine tumours are classified as DIPG. Throughout, reproducibility of findings is demonstrated for the combined (DMG/DIPG) patient cohort and across restricted cohorts of children with biopsied pontine or thalamic DMG, H3K27-altered. Patient tumours were segmented on preoperative brain magnetic resonance imaging (MRI) and mapped to a standard paediatric template (Extended Data Fig. 1a–c). Tumour locations were compared between patients with short- and long-term overall survival using voxel-based lesion-symptom mapping (VLSM). Univariate VLSM across discovery cohort pontine and thalamic tumours identified a significant association between patient short-term survival and tumour pontine location (Extended Data Fig. 1d,e), reflecting the known shorter overall survival of children with pontine versus thalamic DMG2. Aiming to identify specific voxels within the pons or thalamus associated with patient short- versus long-term survival, we performed separate univariate VLSM for pontine and thalamic tumour locations and multivariate VLSM across all tumour locations. Across both methods, no voxels associated with short-term survival were identified (Fig. 1b and Extended Data Fig. 1f–h). To test for any prognostic impact of subthreshold VLSM results (defined as weak, non-significant voxelwise associations with short-term survival), we collected data from an independent cohort of children with primary pontine DMG/DIPG (n = 80) or thalamic DMG (n = 45) treated at one of three international centres or included in the HERBY trial (NCT0139094824; Supplementary Table 1), with identical inclusion criteria. The weighted overlap of each tumour in this external validation cohort with univariate and multivariate VLSM maps, respectively, was computed and averaged to generate an overlap score25. No survival difference was identified between patient tumours stratified into high- and low-overlap risk groups using a median cut-off across univariate and multivariate VLSM (Extended Data Fig. 1i–l). Given this lack of association between tumour location and patient survival, the influence of neural activity on DMG growth in preclinical models3,4,5,6,7,8 and the fact that human DMG/DIPG exhibits a common pattern of brain infiltration (Extended Data Fig. 2), we hypothesized that tumour connectivity with an underlying brain network would better explain the observed variance in patient survival.Fig. 1: Pontine and thalamic DMG map to a conserved, prognostic brain network.The alternative text for this image may have been generated using AI.Full size imagea, Overview of the study methodology. NGS, next-generation sequencing. b, The tumour locations of short-term and long-term survivors of pontine DMG/DIPG and thalamic DMG from the discovery cohort (n = 125; left, red) were compared using VLSM; however, tumour locations did not explain the observed variance in patient overall survival (right; PFWE > 0.05). c, Tumour network mapping was performed to compute the network of brain regions connected to each patient’s tumour location using resting-state functional connectivity data from 1,000 healthy children aged 9.0 ± 0.2 years (the human connectome). Tumour network maps across patients with short-term overall survival (n = 106) were statistically compared to identify brain regions that are significantly associated with shorter patient overall survival (right; network peaks are shown in dark blue), hereafter termed the DMG network. d, DMGs exhibit a specific pattern of brain functional connectivity associated with patient short-term overall survival. This includes strong positive connectivity with the pons, thalamus (centromedian, medial pulvinar and ventral intermediate nuclei), motor cortex (M1 and supplementary motor area (SMA)), orbitofrontal (OFC) and insular cortices, limbic system (amygdala, hippocampus, basal ganglia and anterior cingulate cortex (ACC)), superior temporal gyrus (STG) and cerebellum (lobules I–V, VIII and X). e,f, Identical tumour network mapping performed across two independent external validation cohorts (external validation cohort network (e) and PNOC trial cohort network (f)) reproduced DMG network topography. n = 125 children with primary pontine DMG/DIPG and thalamic DMG, n = 108 short-term survivors (e); n = 38 children with biopsy-confirmed pontine DMG, n = 29 short-term survivors (f). For e, DMG network whole brain spatial ρ = 0.952, label permutation P < 0.001; spin spatial ρ = 0.974, spin permutation P < 0.001. For f, DMG network whole brain spatial ρ = 0.911, label permutation P < 0.001, spin spatial ρ = 0.885, spin permutation P < 0.001. Statistical maps were generated using threshold-free cluster enhancement and corrected for multiple comparisons using familywise error (FWE) rate correction for multiple testing. Two-tailed PFWE < 0.01 was considered significant for connectivity data. Brain slices are shown in radiological orientation. The diagram in a was created using BioRender; Sidpra, J. https://BioRender.com/vi1xgg0 (2026).Lesion network mapping is a computational neuroimaging method that harnesses population-level (n = 1,000) connectomic data to model common brain network connections across different lesion locations26,27,28. It has successfully identified brain networks and therapeutic targets across neurological and psychiatric disorders, including epilepsy29,30, addiction31 and depression32. Here, we develop tumour network mapping, using a lesion network mapping framework, to identify common brain network connections associated with the short-term survival of patients with DMG, irrespective of tumour primary pontine or thalamic location. Tumour volume was included as a covariate in tumour network mapping analyses to account for potential confounding by lesion size26,29,31. In this cohort, tumour volume was not associated with overall survival (univariate Cox hazard ratio (HR) per 1,000 mm3, increase of 1.00; 95% confidence interval (CI) = 0.99–1.01; P = 0.569), consistent with previous clinical reports33,34. Given our aim to identify polysynaptic and direct structural connections between brain regions, whole-brain-to-tumour connectivity analyses were performed across paediatric resting-state functional connectivity (functional MRI, fMRI)35 and structural connectivity (diffusion-weighted MRI, dMRI)36,37 data. These analyses identified a distributed brain network associated with shorter patient overall survival (Fig. 1c). More specifically, tumours exhibiting greater positive functional connectivity with the pons, thalamus, motor cortex, insular and orbitofrontal cortices, limbic system (amygdala, hippocampus, basal ganglia and cingulate cortex), superior temporal gyrus and cerebellum were associated with shorter patient overall survival (Fig. 1d and Supplementary Table 2). Hereafter, we refer to this discovery cohort-defined map of functional brain network connections associated with shorter patient overall survival as the DMG network (Fig. 1d). Concordantly, tumours exhibiting greater structural connectivity with these brain areas through the cerebellar peduncles, corticospinal tracts, corpus callosum, corticobulbar tracts and spinal–limbic pathways were associated with shorter overall survival (Extended Data Fig. 4a).The DMG network and its structural connectivity were robust to statistical methods (Extended Data Figs. 3a–c and 4a–d); specificity testing for connectivity differences between short- and long-term survivors (Extended Data Figs. 3d and 4e); controlling for patient age and sex (Extended Data Figs. 3e and 4f); controlling for tumour primary pontine or thalamic location (Extended Data Figs. 3f,g and 4g,h); restricting to biopsied pontine DMG, H3K27-altered, only (Extended Data Figs. 3h and 4i); and controlling for mean peritumoural anatomical distortion (Extended Data Figs. 3i and 4j). The DMG network was also reproducible when using both clinically reported cut-offs for the long-term survival of patients with DMG (≥18 months23 and ≥24 months38, respectively; Extended Data Figs. 3a,j and 4a,k) and with a continuous contrast for patient overall survival, although this captured less of the network at stricter statistical thresholds (Extended Data Figs. 3k and 4l). The parenchymal origin of pontine fMRI signal was confirmed through the inclusion of fourth ventricular cerebrospinal fluid signal as a co-regressor in partial correlation analysis when computing the functional connectivity of each patient tumour (Extended Data Fig. 3l) and through visualization of increasing statistical thresholds (Extended Data Fig. 3m,n). DMG network spatial topography was replicated across two unique, population-level adult functional connectomes with different preprocessing methods39,40 (Extended Data Fig. 5a–d). In all instances, the similarity of control networks to the DMG network was assessed against a null distribution of 10,000 networks using two methods: (1) label permutation testing, in which each patient’s functional connectivity map was randomly paired with another patient’s overall survival value to generate each null network; and (2) spin permutation testing, in which the DMG network was parcellated and randomly rotated to generate each null network. Finally, visualization of thresholded control network overlap demonstrated convergent topography (Extended Data Fig. 5e,f).To test for DMG network reproducibility, we performed tumour network mapping using identical methods across two independent cohorts: the previously described multicentre external validation cohort (n = 125) and a second cohort of 38 children with biopsy-confirmed pontine DMG, H3K27-altered, included as a secondary analysis of Pediatric Neuro-Oncology Consortium (PNOC) trial data (Supplementary Table 1). Across both independent cohorts, tumours demonstrated the same pattern of brain network connections associated with short-term overall survival, converging to the primary, discovery cohort-defined DMG network (Fig. 1e,f and Extended Data Fig. 4m). Collectively, these data define a conserved, prognostic human brain network across pontine and thalamic DMG, connectivity with which is associated with shorter patient overall survival.DMG network connectivity predicts patient survivalTo validate the prognostic importance of the DMG network, the mean strength of network-to-tumour connectivity with the primary, discovery cohort-defined DMG network was computed for each tumour across both external validation cohorts: data that were not used to define the DMG network. Network-to-tumour connectivity was computed as the weighted overlap of patient-level tumour functional connections with DMG network prognostic connections and patients stratified into high- and low-connectivity risk groups using a median cut-off25. Kaplan–Meier survival analyses demonstrated a significant survival difference across both independent cohorts such that children with higher network-to-tumour connectivity had shorter overall survival (Fig. 2a,b). Univariable and multivariable Cox proportional hazards models incorporating clinical covariates (age, sex, extent of resection, and completion of adjuvant radiotherapy and chemotherapy) confirmed network-to-tumour connectivity as an independent predictor of overall survival in children with DMG/DIPG (Fig. 2a,b). These findings were replicated across connectomes (Extended Data Fig. 5c,d) and an orthogonal method for computing network-to-tumour connectivity29 (Extended Data Fig. 6a). Notably, minimum, maximum and summed network-to-tumour connectivity were not prognostic, reinforcing the importance of distributed, network-level effects rather than isolated strong or weak connections (Extended Data Fig. 6b–d). Although minimum connectivity stratified patients into survival groups, this reflected a tumour-wide shift towards higher or lower mean network-to-tumour functional connectivity (Spearman’s ρ = 0.23; P = 0.011), and failed to survive multivariable modelling. Similarly, DMG network structural connectivity, representative of monosynaptic connections, was non-prognostic (Extended Data Fig. 7a). To confirm this and directly compare the prognostic impact of tumour network and tumour location information, we constructed Cox proportional hazards models incorporating tumour–VLSM map overlap and DMG network-to-tumour functional and structural connectivity. High functional connectivity was robustly associated with survival, whereas neither structural connectivity nor tumour–VLSM overlap showed prognostic significance (Extended Data Fig. 7b,c). Taken together, mean DMG network-to-tumour functional connectivity was robustly and reproducibly associated with patient overall survival.Fig. 2: DMG-network-to-tumour connectivity predicts overall survival in children with DMG.The alternative text for this image may have been generated using AI.Full size imageKaplan–Meier survival curves and associated multivariable Cox proportional hazard models demonstrate shorter overall survival in children whose tumours exhibit higher DMG network connectivity and confirm network-to-tumour connectivity as an independent predictor of patient overall survival. a, The network-to-tumour connectivity of 125 children with primary pontine DMG/DIPG and thalamic DMG in an independent external validation cohort was computed on the discovery DMG network. Kaplan–Meier median overall survival, 8.5 versus 13.3 months; 95% CI = 7.4–9.5 versus 11.7–15.5 months; P = 1.76 × 10⁻⁷. Multivariable Cox HR = 2.27, 95% CI = 1.48–3.47, P = 0.000161. b, The network-to-tumour connectivity of 38 children with biopsy-confirmed pontine DMG, H3K27-altered was computed on the discovery DMG network. Kaplan–Meier median overall survival, 9.9 versus 13.0 months; 95% CI = 7.3–13.1 versus 11.1–21.9 months; P = 0.052. Multivariable Cox HR = 2.68, 95% CI = 1.17–6.13, P = 0.020. c, The network-to-tumour connectivity of 191 children with pontine DMG/DIPG was computed on a thalamic DMG network. Kaplan–Meier median overall survival, 8.7 versus 9.7 months; 95% CI = 8.2–9.6 versus 8.9–11.4 months; P = 0.046. Multivariable Cox HR = 1.42, 95% CI = 1.06–1.90, P = 0.019. d, The network-to-tumour connectivity of 59 children with thalamic DMG was computed on a pontine DMG/DIPG network. Kaplan–Meier median overall survival, 12.2 versus 17.0 months; 95% CI = 8.3–16.6 versus 13.4–31.0 months; P = 0.026. Multivariable Cox HR = 1.88, 95% CI = 1.03–3.46, P = 0.041. In the forest plots, each dot represents an estimated HR and whiskers represent the corresponding 95% CI; dot size is for visualization only and does not denote statistical weight. Fc, functional connectivity.DMGs are characterized by canonical (H3.1 or H3.2) or non-canonical (H3.3) alterations in histone 341 or EZHIP overexpression42, all of which result in polycomb repressor complex 2 (PRC2) inhibition43, global loss of H3K27 trimethylation and widespread epigenetic dysregulation44. Two molecular prognostic groups have been reported, defined by TP53 or BRAF/FGFR1 oncogenic variants23. We analysed paediatric solid tumour next-generation DNA panel sequencing data for a subcohort of 87 children with pontine or thalamic DMG, comparing the mean DMG network-to-tumour connectivity strength for each alteration. Negative results suggest that network-to-tumour connectivity is independent of tumour histone status and co-mutations (Extended Data Fig. 6e).To formally test whether pontine and thalamic DMGs exhibit prognostic convergence to the same brain network, we performed tumour network mapping separately for all pontine DMG/DIPG and all thalamic DMG, defining distinct prognostic networks (Extended Data Fig. 3f,g). The mean connectivity strength of pontine DMG/DIPG and thalamic DMG was computed with the alternate location network to test for a survival association. Kaplan–Meier survival curves and univariable and multivariable Cox proportional hazards models incorporating clinical covariates consistently demonstrated an inverse relationship between high network-to-tumour connectivity and patient survival, confirming convergent prognostic networks independent of tumour primary location (Fig. 2c,d). Similar and overlapping HRs suggest conserved network effects across tumour locations. The prognostic impact of DMG network-to-tumour connectivity was also reproducible when restricting the external validation cohort to children with biopsy-confirmed pontine DMG, H3K27-altered (Extended Data Fig. 6f), and when analysing a second, independent cohort of children with biopsy-confirmed pontine DMG, H3K27-altered (PNOC trial cohort; Fig. 2b).We next sought to confirm the predictive power and incremental prognostic value of network-to-tumour connectivity beyond standard clinical variables. To this end, we fitted clinical-only and combined clinical–connectivity multivariable Cox proportional hazards models on all patients in the discovery cohort and applied the fully parameterized models with frozen coefficients to the independent external validation cohort, comparing model discriminatory power. In the external validation cohort, the inclusion of network-to-tumour connectivity improved prognostic discrimination relative to clinical variables only (concordance index, 0.621 versus 0.577; difference in concordance index (ΔC) = 0.044, 95% CI = 0.016–0.074, P = 0.002), confirming that network-to-tumour connectivity provides independent prognostic information beyond established clinical factors.We hypothesized that the DMG network would specifically predict the survival of children with DMG rather than patients with other high-grade glioma subtypes: mirroring preclinical evidence for some distinct, tumour subtype-specific mechanisms of neuron–glioma interaction6,45. To test this, we analysed two independent cohorts of adult patients with glioblastoma (GBM), IDH-wild type: a previously reported cohort of 248 patients (UCSF-PDGM)46 and a cohort of 272 patients treated at the National Hospital for Neurology and Neurosurgery, London (Supplementary Table 3). Across cohorts, GBM connectivity with the DMG network was not associated with GBM patient overall survival (Extended Data Fig. 6g,h). To further test DMG network specificity, we investigated whether DMG network prognostic effects reflect common paediatric connectome brain architecture, computing the row summation vector of the group-average Adolescent Brain Cognitive Development Study (ABCD1000) connectivity matrix (∑C)47. While ∑C was spatially similar to the DMG network (Extended Data Fig. 5g), tumour connectivity with ∑C was non-prognostic (Extended Data Fig. 5h). Moreover, after regressing out ∑C from tumour network maps, the residual DMG network remained topographically similar to the primary DMG network and predicted overall survival in independent datasets (Extended Data Fig. 5i,j). These results indicate that, although DMGs exhibit connectivity with constitutively active hub-like brain regions, the prognostic value of the DMG network is insufficiently explained by connectome structure and, instead, reflects a disease-specific prognostic circuit48. Taken together, these findings demonstrate that, despite disparate anatomic origins, DMG network-to-tumour connectivity is independently and specifically predictive of overall survival in children with DMG.Tumour progression maps to the DMG networkDMG diffusely and contiguously infiltrate brain parenchyma. Neural activity in distant brain regions projecting onto high-grade glioma cells promotes directional growth through paracrine and synaptic mechanisms in mouse models12,49. We investigated whether tumour invasion and metastasis exhibit directionality to defined DMG network peaks. First, we identified a subcohort of 71 children with paired diagnostic and final follow-up MRI acquired within 2 months of death, representing near-final disease progression (Supplementary Table 4). Tumour growth maps were generated through subtraction of final progression maps from baseline tumour maps (Fig. 3a). Anatomically, tumour growth mapped to the DMG network, with greater growth in network than out-of-network brain (Fig. 3b). To examine the specificity of tumour growth to peaks of greatest connectivity in the DMG network, we studied 34 children with tumour progression beyond the primary site and computed the connectivity of each tumour with DMG network peak clusters (Supplementary Table 2), controlling for the distance of each primary tumour to each network peak. Correlative analyses identified greater tumour burden in DMG network peaks with which each tumour was more functionally connected (Fig. 3c). Paired examples of tumour maps at diagnosis and final follow-up illustrate the convergence of tumour growth with DMG network-defined trajectories (Fig. 3d,e). Of note, we did not identify a correlation between network-to-tumour connectivity and tumour volumetric growth (Spearman’s ρ = −0.02; P = 0.932), consistent with initial survival analyses, which did not identify an association between tumour volume and overall survival. Finally, we investigated whether non-contiguous metastatic DMGs exhibit similar tropism to the DMG network: identifying six children with intracranial parenchymal (non-leptomeningeal) metastases secondary to primary spinal DMG, H3K27-altered, in an independent cohort of children with primary spinal DMG (total n = 36). Tumour network overlap maps illustrate almost complete localization of intracranial metastatic lesions to the DMG network, with significantly greater metastatic disease in network than out-of-network brain (Extended Data Fig. 8). Collectively, these data provide evidence linking the anatomic pattern of DMG growth to circuit-specific trajectories within the DMG network.Fig. 3: DMG network topography aligns with tumour growth and neurometabolic development.The alternative text for this image may have been generated using AI.Full size imagea, Tumour network overlap maps illustrate DMG/DIPG anatomic distribution at the time of diagnostic MRI and new tumour growth from diagnostic to final MRI within 2 months of death. n = 71 children with paired MRI. The voxelwise tumour frequency is plotted on a scale of red to white; DMG network is shown on a scale of blue to yellow. b, New tumour growth was greater within the DMG network than out of the DMG network (n = 71; median, 13,768 mm3 versus 1,270 mm3; 95% CI = 11,293–17,763 mm3 versus 773–1,792 mm3; two-tailed paired Wilcoxon signed-rank test, P = 6.85 × 10⁻¹³). The box plots show the median (centre line), interquartile range (IQR; box limits) and individual observations (dots), and the whiskers extend to the most extreme values within 1.5× IQR. c, Tumour growth into DMG network nodes correlated with node-to-tumour connectivity, correcting for tumour-wise distance to each node. n = 34 children with metastatic growth beyond primary tumour site. Mean Spearman’s ρ = 0.68, 95% CI = 0.63–0.72. All but two individual patient correlations were significant after Benjamini–Hochberg correction (two-tailed PFDR < 0.05). The patient-level ρ is shown in grey; the group-level median is shown in red with bootstrapped 95% CIs. d,e, Tumour-network overlap maps of representative pontine (d) and thalamic (e) DMG/DIPG at the time of the diagnostic and final MRI illustrate growth aligned with DMG network connectivity. f, Bar plot of whole-cohort age incidence (red; n = 284 children, four children aged >17 years excluded) with line and scatter plots of age-consecutive mean-squared differences (MSDs) in brain-wide [18F]FDG-PET signal across childhood (blue; 0–16 years) demonstrate temporal alignment of peak tumour incidence with peak [18F]FDG-PET signal changes (R = 0.612, linear regression P = 0.012). Brain-wide spatial maps above each bar depict brain regions with peak neurometabolic flux at each age (standardized uptake value (SUVMax); red indicates positive change), which predominate within the DMG network at ages of peak DMG incidence (5–6 years: voxelwise spatial ρ = 0.199, label permutation P < 0.001, spin spatial ρ = 0.512, spin permutation P < 0.001; 10–11 years: voxelwise spatial ρ = 0.044, label permutation P < 0.001, spin spatial ρ = 0.179, spin permutation P < 0.001).DMG incidence reflects neurometabolic developmentThe early childhood peak incidence of pontine gliomas has been reported since the mid-1950s50. Specifically, DMGs occur in a distinct spatiotemporal pattern during childhood and are rare in adulthood (pontine and thalamic DMG peak incidence, 6 and 11 years, respectively)2. This aligns with periodic changes in postnatal myelination and neural circuit maturation, concordant with key neurodevelopmental stages and the oligodendrocyte precursor cell (OPC)-like lineage of DMG51,52. We hypothesized that the neurometabolic development of brain circuits in the DMG network would explain the spatiotemporal pattern of DMG incidence. To investigate this, we examined the relationship between DMG whole-cohort age incidence and normative [18F]fluoro-2-deoxy-d-glucose positron emission tomography ([18F]FDG-PET) signal within the DMG network from 0 to 16 years of life53. Regression of age incidence and voxelwise mean-squared differences in consecutive, age-averaged signal changes exhibited a strong linear dependence (R = 0.612, P = 0.0118), with the maximal peak change in [18F]FDG-PET signal at 5–6 years of life and the second maximal peak change at 11–12 years of life, coinciding with the respective peak age incidence of pontine and thalamic DMG (Fig. 3f).We next evaluated whether peak neurometabolic changes were specific to brain regions within the DMG network. First, the [18F]FDG-PET signal from each of 46 brain regions, defined as within or out of the DMG network, was extracted and regressed with DMG age incidence, identifying that [18F]FDG-PET signal changes in brain regions within the DMG network explained significantly greater variance in incidence than the signal in the rest of the brain (median in-network R = 0.327 versus median out-of-network R = 0.197; two-tailed Mann–Whitney U-test, false-discovery rate (FDR)-corrected P = 0.015). Next, the greatest voxelwise changes in [18F]FDG-PET signal at each age were identified and spatially compared to DMG network topography. Strikingly, the top two peak positive neurometabolic changes during childhood were spatially dominated by brain areas within the DMG network at ages of peak DMG incidence (5–6 years, pontine peak; 10–11 years, thalamic second peak; Fig. 3f). Anatomically, these peak neurometabolic changes were more similar to the DMG network than expected by chance, in contrast to changes at other ages (Supplementary Table 5). Together, these data characterize the DMG network as a site of spatiotemporally organized neurometabolic development associated with tumour incidence. This alignment defines a neurodevelopmental window in which brain regions within the DMG network undergo their most significant neurometabolic transitions, possibly reflecting critical periods of vulnerability to DMG initiation through neural activity.Synaptic gene enrichment in high-connectivity DMGTo elucidate the transcriptional programs underpinning phenotypic differences between high- and low-connectivity DMG, we analysed single-nucleus RNA sequencing (snRNA-seq) data from seven fresh-frozen patient surgical samples within our cohort (Fig. 4a,b). Tumour tissue was dissociated and underwent fluorescence-activated cell sorting to isolate single nuclei (Extended Data Fig. 9a). A median of 4,707 nuclei per sample and 1,734 genes per nucleus passed quality control, totalling 42,504 single nuclei (Extended Data Fig. 9b,c). Malignant and non-malignant cell populations were first classified using copy-number variation and refined using Azimuth reference mapping and previously defined marker genes (Fig. 4c and Extended Data Fig. 9d,e). Across malignant cells (n = 32,543), OPC-like cells (glial cells that normally engage in neuron-to-glial cell synapses54) predominated using reference cell state signatures52 (Fig. 4c). DMG transcriptional architecture was conserved between high- and low-connectivity DMG, with no specific cell state expansion (Fig. 4d and Extended Data Fig. 9f,g). Strikingly, however, high-connectivity DMG demonstrated specific enrichment of transcriptional signatures previously associated with the formation of neuron-to-glioma synapses12 (Fig. 4e), patient biopsy-isolated DIPG synaptic character3 (Fig. 4f) and tumour invasivity12 (Extended Data Fig. 10a). Tumour genome-wide bulk DNA methylation data from a larger cohort of children with primary pontine and thalamic DMG (n = 36; Supplementary Table 6) confirmed significant hypomethylation of gene CpG sites within these signatures in high-connectivity DMG (Extended Data Fig. 10b,c). Specific enrichment of synaptic genes in high-connectivity DMG held true across a diverse neurotransmitter repertoire, including glutamatergic, cholinergic, serotonergic and noradrenergic signalling (Fig. 4g and Extended Data Fig. 10d–g). This increased expression was particularly prominent in OPC-like tumour cells but persisted with lineage maturation along the OPC-oligodendrocyte (OC) axis, suggesting the presence of a more mature, neuronal-responsive population in high-connectivity DMG (Fig. 4g). Despite the known growth-promoting role of GABAergic signalling on DMG cells6, GABAergic signalling was paradoxically decreased in high-connectivity DMG, perhaps reflecting a degree of circuit-dependent plasticity and the relatively short-range nature of GABAergic interneurons located in the local tumour microenvironment rather than projecting from distant brain regions (Extended Data Fig. 10h). Importantly, the activity-dependent release of the paracrine factor NGLN3 is required for DMG progression7,8. Previous work has defined genes upregulated in DMG cells exposed to NLGN3 versus control as well as genes encoding the signalling proteins that are responsive to NLGN3 (refs. 7,8). High-connectivity DMG exhibited upregulation of both signatures, suggesting increased activity-dependent NLGN3 signalling (Fig. 4h,i). Together, these data demonstrate meaningful, tissue-level differences between high- and low-connectivity DMG. Furthermore, they support preclinical evidence implicating neuromodulatory neurotransmitters in DMG progression5,9,18 and suggest increased neuron-to-glioma synaptic integration as a feature of high-connectivity DMG.Fig. 4: Synaptic gene enrichment in high-connectivity DMG.The alternative text for this image may have been generated using AI.Full size imagea, Methodological schema. b, snRNA-seq cohort characteristics (n = 7). WT, wild type. c, Uniform manifold approximation and projection (UMAP) of 42,504 single nuclei and identified cell type clusters. d, The frequency of malignant cell states in high- and low-connectivity DMG. e,f, Malignant cell signature expression projected onto cell lineage (x axis; astrocytic (AC)-to-oligodendrocytic (OC) differentiation) and stemness (y axis; stem to differentiated) scores with corresponding violin plots. The red–blue colour scale indicates the relative gene signature enrichment: neuronal12 (e) and DIPG synaptic score3 (f). g, Relative neurotransmitter gene signature enrichment in high- versus low-connectivity DMG. h,i, Malignant cell signature expression projected onto cell lineage and stemness scores with corresponding violin plots: genes upregulated in response to NLGN33 (h) and genes encoding NLGN3-induced signalling proteins3 (i). j, Spatial representation of brainstem nuclei DMG network connectivity strength (network peaks dark blue). For visualization, only the strongest 5% of brainstem nucleus-nucleus functional connections are shown. k, The top two brain-wide neurotransmitter receptor and transporter density distributions with the greatest contribution to DMG network chemoarchitecture. l, The percentage neurotransmitter contribution to overall fit of a multiple linear regression model between brain-wide DMG network functional connectivity and 18 neurotransmitter receptor and transporter density profiles. m, Pairwise comparison of nucleus-to-tumour connectivity across short- and long-term survivors of DMG/DIPG demonstrated significantly greater connectivity to cholinergic (PFWE = 0.001), serotonergic (PFWE = 0.0002) and noradrenergic (PFWE = 0.0004) nuclei than dopaminergic nuclei in short-term survivors (one-way analysis of variance (ANOVA) with Tukey’s post-hoc test, F = 16.84, P = 6.40 × 10⁻⁵; factor neurotransmitter system with four levels). In l and m, the dots represent the adjusted R2 for each neurotransmitter receptor and transporter; the whiskers represent the 95% CI. Signature enrichment across malignant single nuclei (n = 32,543) was assessed using a two-tailed Wilcoxon signed-rank test. The violin plots denote median (centre line) and IQR (box limits), the whiskers extend to the most extreme values within 1.5× IQR and individual observations are shown by dots. The diagram in a was created using BioRender; Sidpra, J. https://BioRender.com/vi1xgg0 (2026).DMG network chemoarchitectural organizationThese observations raised the question of whether the DMG network represents a functional architecture comprised of specific neurotransmitter projections. Parcellation of the DMG network into brainstem nuclei identified peaks in the locus coeruleus and subcoeruleus (noradrenergic); parvicellular reticular nuclei, part alpha (serotonergic); pontine oralis reticular nuclei (serotonergic and cholinergic); and laterodorsal tegmental nuclei (cholinergic) (Fig. 4j). As cortical functional topographies align with projections from brainstem neuromodulatory nuclei55, we next sought to define the chemoarchitecture of the DMG network (defined as the spatial alignment of brain-wide neurotransmitter receptor and transporter densities with network topography). Leveraging a PET atlas, we modelled the distribution of 18 human neurotransmitter receptor and transporter densities across the DMG network56. Dominance analyses identified signalling through serotonergic 5HT2A and cholinergic M1 muscarinic receptors as the greatest contributors to DMG network chemoarchitecture (>25% model fit; Fig. 4k,l). Further, pairwise comparison of brainstem nucleus-to-tumour connectivity in short- versus long-term survivors of DMG demonstrated significantly greater connectivity with cholinergic, serotonergic and noradrenergic nuclei (but not dopaminergic nuclei) in short-term survivors (Fig. 4m). Taken together, these results suggest that tumour connectivity with the DMG network occurs within a chemoarchitectural niche that DMGs are known to exploit.DMG resection as network disconnectionHigh-grade gliomas form interconnected, communicating cellular networks3. Selective surgical and pharmacological disconnection of network hubs compromises network activity and tumour growth in preclinical models3,11. Although neurosurgical interventions for pontine DMG are typically limited to tissue biopsy given the brainstem location of the disease, the prognostic benefit of gross-total resection for thalamic DMG is well reported, if rarely achieved57. The role of more limited debulking procedures (defined as a subtotal resection >10% but <90% tumour volume), and whether such procedures positively impact patient survival, remain to be demonstrated. We hypothesized that targeted subtotal resections of high-connectivity thalamic DMG subregions would increase overall survival by disrupting prognostic DMG network connections. To investigate this, we defined tumour resection maps for a subcohort of 23 children with thalamic DMG who underwent subtotal tumour resections (Supplementary Table 7). DMG network connectivity values were overlayed onto tumour resection maps to define the mean connectivity strength of resected and non-resected (residual) tumour subregions (Fig. 5a). A significant survival benefit was observed for patients in whom highly connected tumour subregions were resected when compared with lower-connectivity resections (Fig. 5b). This was robust to the inclusion of the percentage of tumour volume resected as a covariate in a multivariable Cox proportional hazards model (Fig. 5c) and no difference was identified in the absolute or percentage tumour volume resected between groups (Fig. 5d,e), indicating that the prognostic impact of high connectomic resection is independent of resected tumour volume. Although these observations require validation in a prospective clinical trial, our combined survival data suggest a network dependence to DMG tumour progression and demonstrate a prognostic benefit for children with thalamic DMG, in whom gross-total resection was not feasible, following selective, volume-agnostic disruption of intratumoural DMG network connectivity.Fig. 5: Survival benefit of high connectomic resections in children with primary thalamic DMG.The alternative text for this image may have been generated using AI.Full size imagea, Tumour resection maps illustrate intratumoural, subregion-specific tumour tissue connectivity with the DMG network in children with thalamic DMG and high-connectomic or low-connectomic subtotal resections across the whole study cohort (n = 23). High-connectivity tumour subregions are shown in yellow and low-connectivity tumour subregions are shown in dark blue. Resected tumour margins are defined in black ink. b, Kaplan–Meier survival curve showing the prognostic benefit of high connectomic resections in children with incidental subtotal resections (STRs) of thalamic DMG (n = 23; median overall survival, 11.2 versus 42.0 months; log-rank test, P = 0.013). The error bars represent the 95% CI. c, The results of a multivariable Cox proportional hazards model demonstrate that the prognostic impact of high-connectomic resection in children with thalamic DMG is independent of extent of resection (n = 23; HR = 0.24, 95% CI = 0.07–0.79, P = 0.019). Mean values are represented by solid circles and the whiskers represent the 95% CI. d,e, No difference was identified in the absolute volume of tumour resected (d; n = 23; median, 6,892 versus 5,603 mm3; two-tailed Mann–Whitney U test, P = 0.479) or in the volumetric percentage of tumour resected (e; n = 23; median, 22.2% versus 17.4%; two-tailed Mann–Whitney U test, P = 0.372) when comparing low- and high-connectivity resections. In b and e, data are median (centre line) and IQR (box limits), the whiskers extend to the most extreme values within 1.5× IQR and individual observations are shown (dots). NS, not significant.DiscussionAlthough the recruitment and bidirectional interactions of otherwise healthy neural populations in neuron–glioma networks are well-characterized in preclinical models, the organization and clinical implications of these connections in the living human brain remained to be elucidated. Here, we develop tumour network mapping to demonstrate that pontine and thalamic DMG map to a conserved brain network, connectivity with which is independently and inversely associated with patient overall survival. The tropism of tumour growth for DMG network connectivity peaks reflects directional, neural activity-dependent tumour infiltration in preclinical models3,5,9 and offers an explanation for the conserved pattern of DMG tumour anatomic progression15,16,17. Although none of the experiments presented here demonstrate, nor could have demonstrated, a direct relationship between tumour neural activity and tumour growth, convergent data presented across multiple modalities27 are consistent with the hypothesis that DMG network connectivity is associated with tumour growth and patient survival. This said, our definition of prognostic brain network connections common to all DMG does not preclude the importance or influence of individual variance in neuron-to-glioma connections within the DMG network that remain to be elucidated. We expect the application of these methods to other glial malignancies will enable the definition of shared and tumour-specific subcircuits important for tumour growth and patient survival.Neural activity is implicated not only in potentiating glioma growth but also glioma initiation and maintenance58,59. We demonstrate that high-connectivity DMGs are enriched for neuronal and synaptic gene programmes and genes upregulated in DMG cells in response to neuronal input, validating DMG network stratification at single-cell resolution. We further show that peak changes in neurometabolic activity across childhood localize to the DMG network, potentially reflecting the developmental maturation and increased neural activity of brain circuits connected to and communicative with DMG as well as a developmental period of increased cellular stress during which DMG may acquire secondary mutations. Emerging human pontine snRNA-seq data spanning the first trimester of life to early adulthood demonstrate upregulated synaptic plasticity gene expression in OPCs at ages of peak DMG incidence, suggesting an interplay between neural, neurometabolic, and transcriptional vulnerability60. Whether such an association extends to other cerebral tumours of childhood remains to be demonstrated and requires a greater understanding of tumour subtype-intrinsic neuron–glioma interactions.The brain-wide prognostic connections represented by the DMG network support preclinical evidence for DMG and other high-grade gliomas occupying an infiltrative niche communicative with brain areas distant from and projecting onto primary tumour cells. Selective surgical disruption of this communication through resection of high-connectivity DMG tumour subregions was associated with longer patient overall survival, suggesting that focal, volume-agnostic lesions of tumour networks may modulate tumour growth, and proposing the DMG network as a testable target for therapeutic neuromodulation in prospective clinical trials. Taken together, our results define a spatially conserved map of prognostic brain network connections in children with DMG and are consistent with preclinical evidence that DMG growth and infiltration are robustly regulated by diverse, brain-wide neuronal interactions. Pharmacological and surgical targeting of these defined vulnerabilities may be critical for the development of novel circuit-level therapeutics for this devastating childhood cancer.MethodsPatient cohortsThis study was approved by the institutional review board of GOSH NHS Foundation Trust (24/HRA/4335) with informed consent waived for retrospective analyses. Primary data collection was also approved by the institutional review boards of each participating study site before study commencement in accordance with the Declaration of Helsinki as amended61. Three independent cohorts of children diagnosed with primary pontine DMG/DIPG or thalamic DMG were identified and analysed retrospectively: (1) a discovery cohort from GOSH, UK; (2) an independent, multicentre external validation cohort from the Children’s Hospital Colorado (CHCO), USA; University of São Paulo, Brazil; Institute of Neurosurgery Dr. Alfonso Asenjo, Chile; and the HERBY clinical trial (NCT01390948)24; (3) a second, independent cohort of children with biopsied pontine DMG, H3K27-altered, enrolled on PNOC clinical trials. Participating centres are major international institutions with recognized subspecialty expertise in paediatric neuro-oncology. PNOC trial inclusion criteria have been previously reported. Inclusion criteria were identical across cohorts 1 and 2, with children reported between January 2000 and January 2024 inclusive:
A prognostic human brain network for diffuse midline glioma - Nature
Tumour network mapping of diffuse midline glioma (DMG) defines a conserved and prognostically important brain network in children with DMG, consistent with the hypothesis that DMGs exploit otherwise healthy brain circuits to promote tumour growth.
20,641 words~94 min read