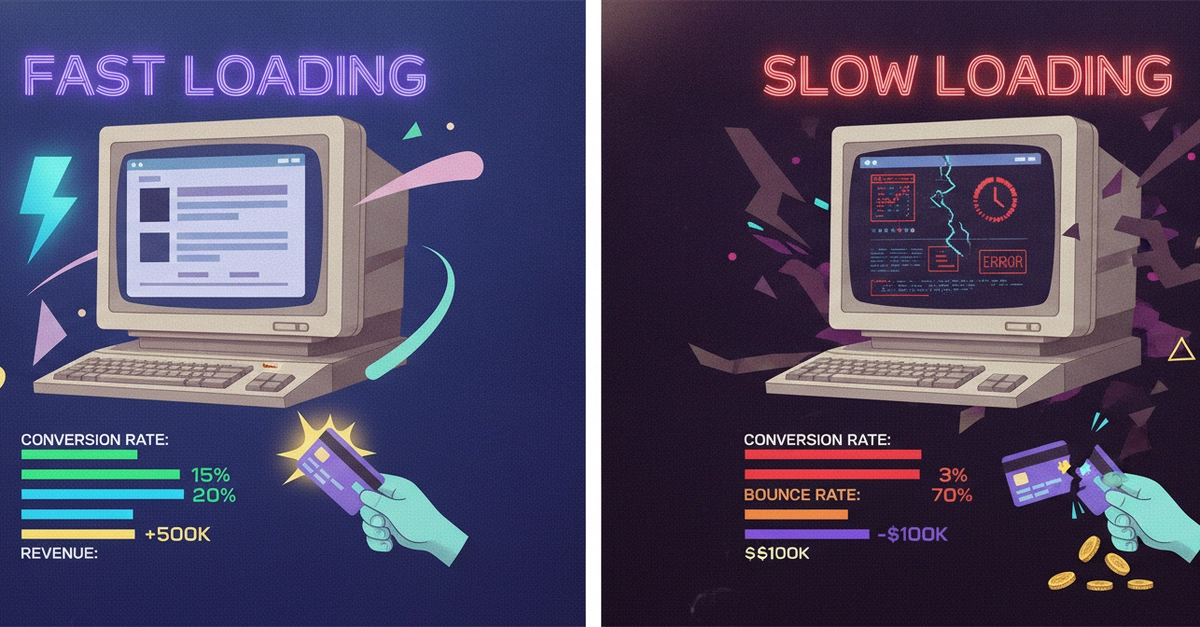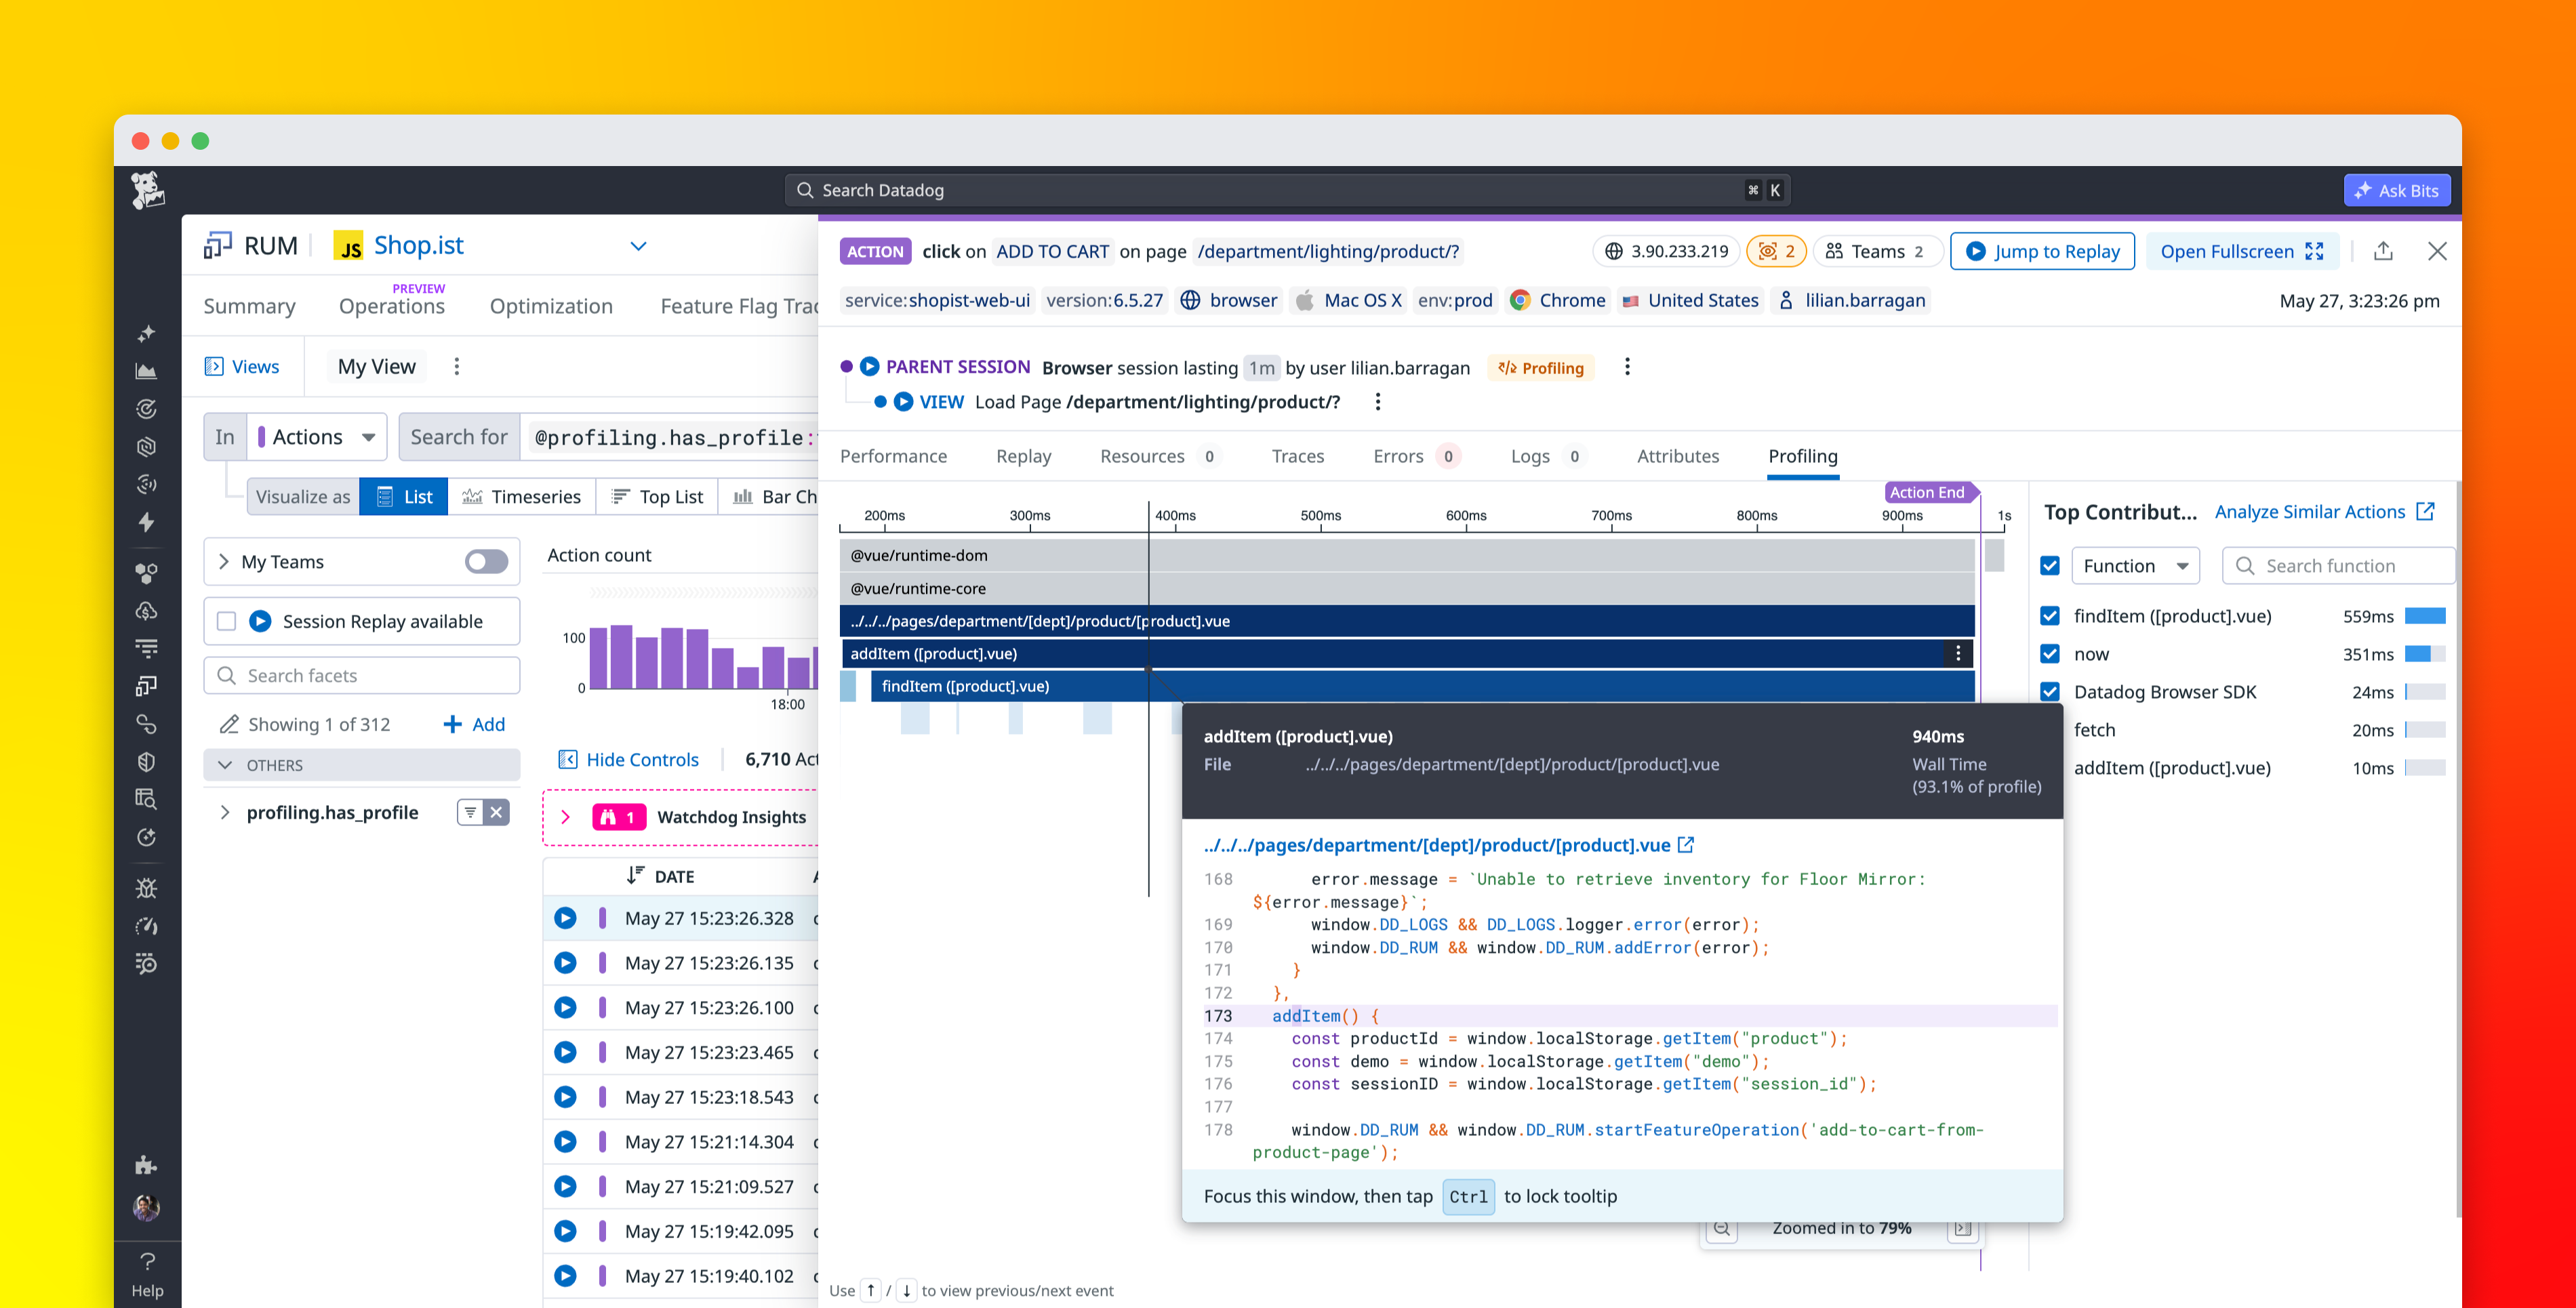
Frontend performance issues are often easy to detect through signals like worsening Interaction to Next Paint (INP) and Largest Contentful Paint (LCP) scores, or through recurring long tasks. Identifying the code responsible for frontend slowdowns, however, is much more difficult. What’s especially challenging is that performance degradations often appear only on specific devices, browsers, or network conditions. They can also take hours for frontend teams to reproduce in a test environment.
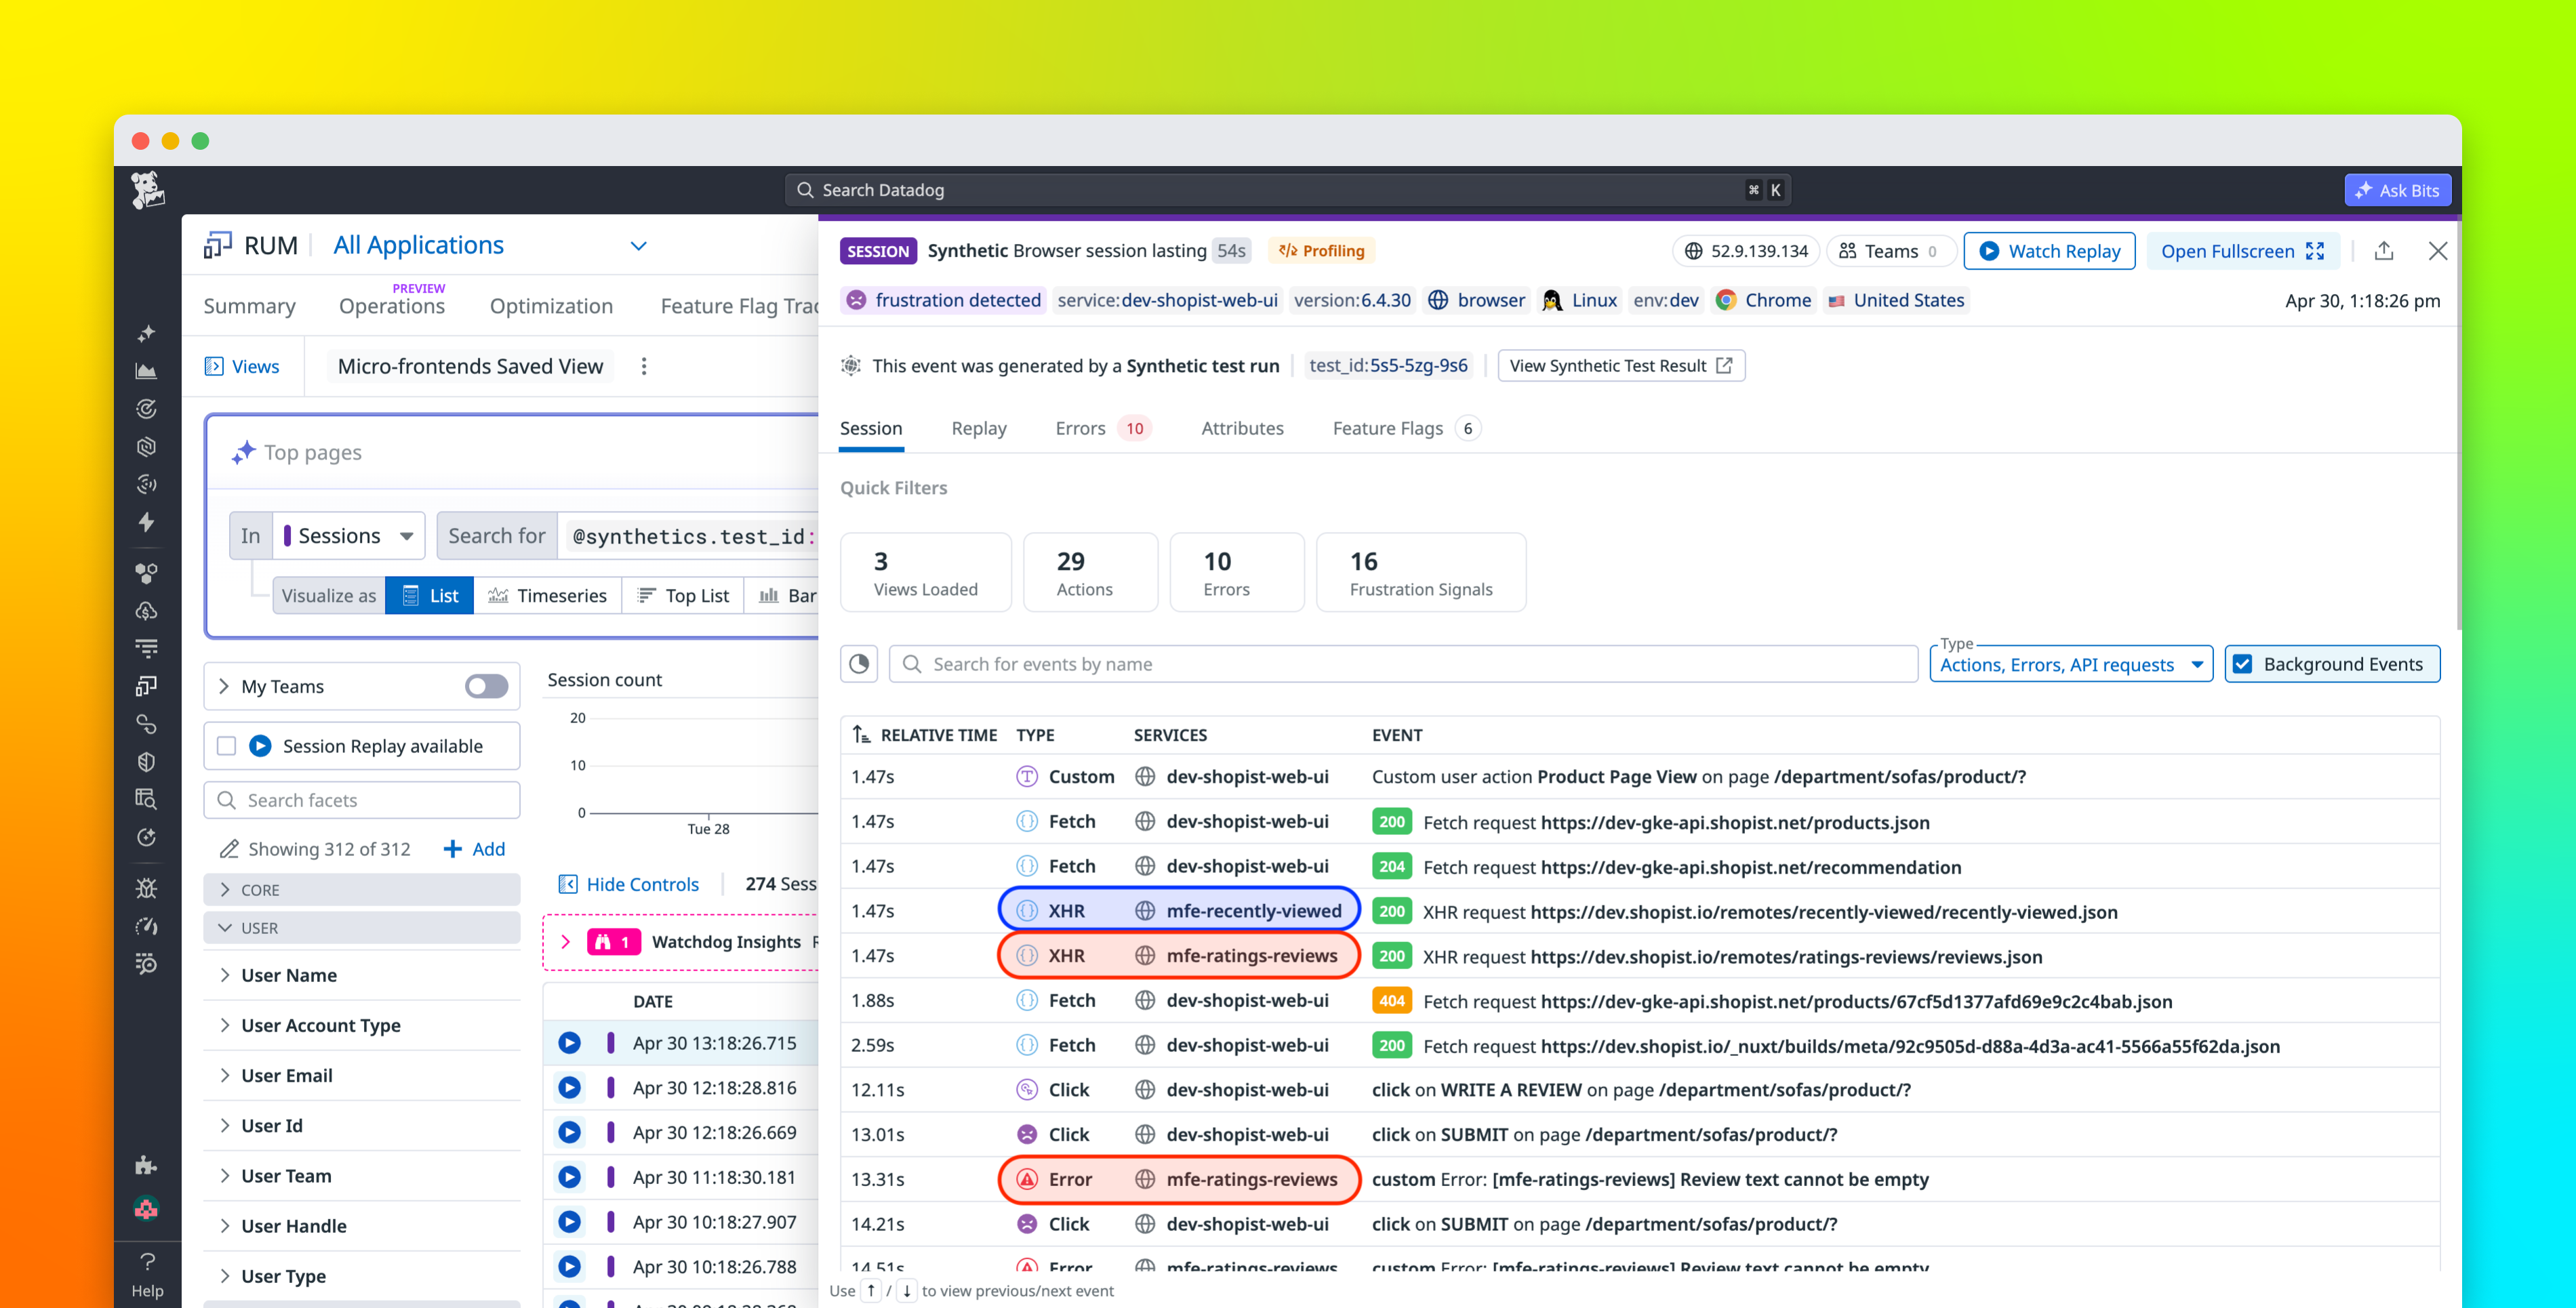
Datadog’s Browser Profiler helps frontend engineers trace the cause of degraded performance directly to the underlying JavaScript code path. By combining profiling data with Datadog Real User Monitoring (RUM), Browser Profiler captures method stack frames from real user sessions and surfaces them directly in the workflows engineers already use for troubleshooting. Teams can investigate slow interactions, identify recurring bottlenecks across thousands of sessions, and compare profiling data across deployments to validate that a fix actually improved performance.
In this post, we’ll show how Browser Profiler helps you:
- Surface code-level root causes when a signal degrades
- Spot systemic bottlenecks with aggregated profiling views