The stock market valuation metric that Warren Buffett once called “probably the best single measure of where valuations stand at any given moment” just hit a number that would make even the Oracle of Omaha uncomfortable. The Warren Buffett Indicator, which measures total US stock market capitalization relative to GDP, has climbed to 236%.
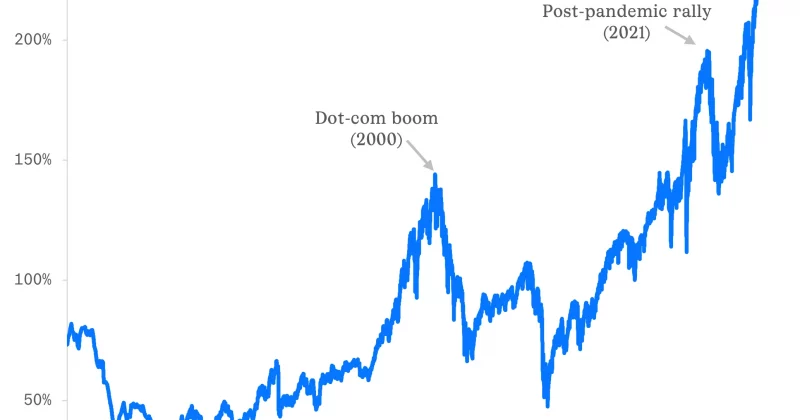
That means US equities are now valued at roughly 2.36 times the country’s entire economic output. For context, the same metric peaked somewhere between 145% and 159% during the dot-com bubble. The current reading isn’t just above that. It’s roughly 50% higher.
What the Buffett Indicator actually measures
Think of it like a price-to-earnings ratio, but for the entire country. Instead of comparing one company’s stock price to its earnings, you’re comparing the total value of all publicly traded US stocks to the nation’s GDP. When the number is high, it suggests stocks are expensive relative to what the economy actually produces.
Buffett popularized this approach in a 2001 Fortune article, back when the wreckage of the dot-com bust was still smoldering. He argued that the ratio offered a clean, broad-stroke view of whether the market had gotten ahead of itself. His warning at the time: readings above 200% mean investors are “playing with fire.”