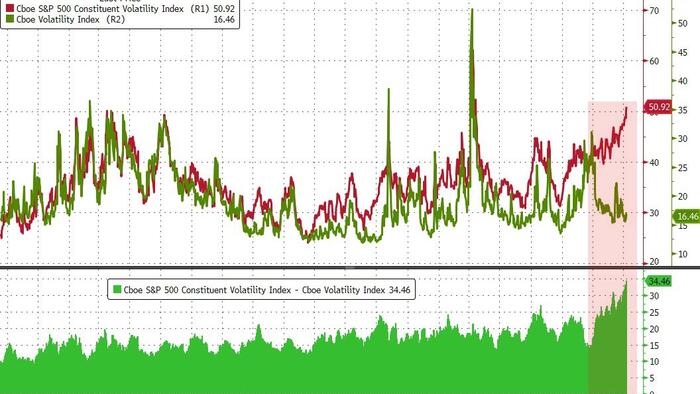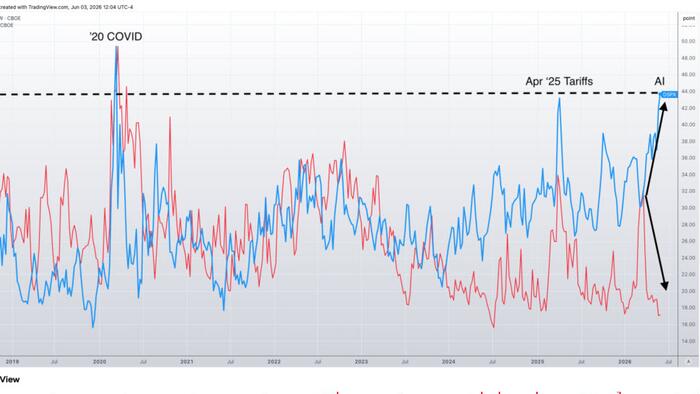
The Nasdaq’s implied correlation has dropped to its lowest level ever recorded. On the surface, that sounds like a good thing. Dig a little deeper, and the picture gets more complicated.
Implied correlation measures how much the market expects individual stocks within an index to move in sync. When it’s high, everything rises and falls together, usually during panics. When it’s low, stocks are charting their own paths.
What the numbers actually say
Short-term implied correlation indices, like the Cboe 1-month measure, have recently printed readings as low as 8.7 to 9.93. To put that in context, implied correlations for both the S&P 500 and Nasdaq 100 have fallen to their lowest levels in at least 23 years. The expected average single-stock correlation for 2026 sits around 23%, which is remarkably low by historical standards.
Cboe’s implied correlation indices, including COR1M and COR3M, measure the gap between how volatile the overall index is expected to be versus how volatile its individual components are expected to be. When that gap gets wide, it means traders are pricing in a world where individual stocks diverge sharply from the pack.