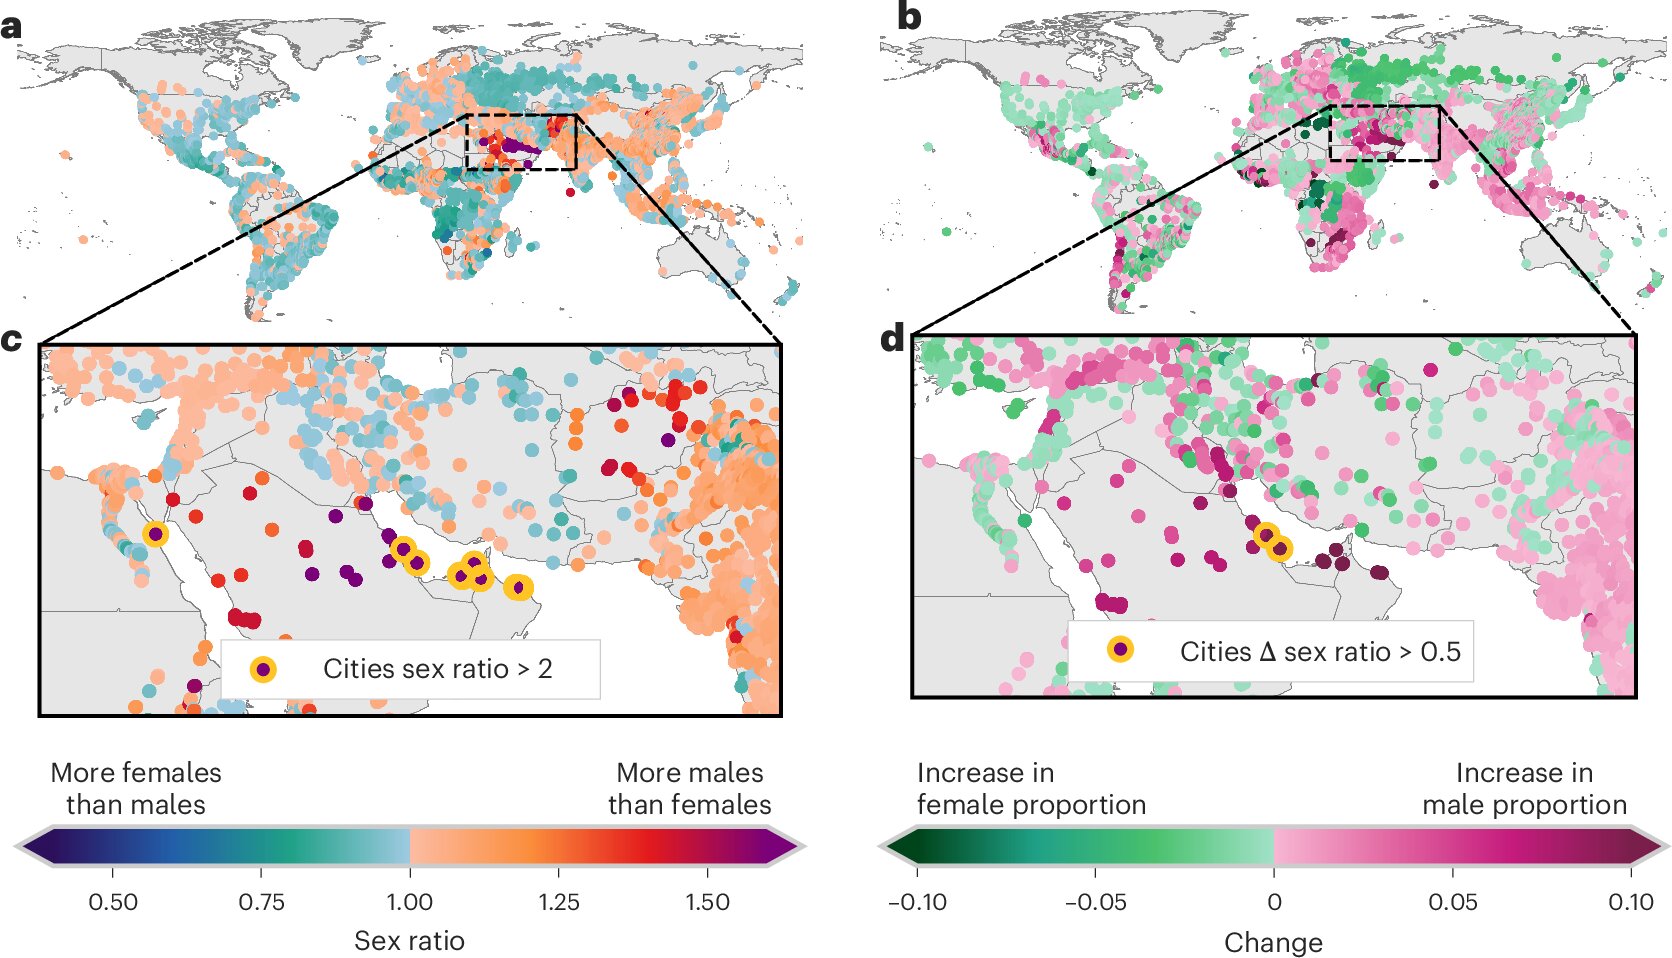
a, Working-age sex ratio in 2020. b, Change in working-age sex ratio between 2000 and 2020. c,d, Expanded views of the Arabian Peninsula from a and b, respectively, to highlight the rapid change in working-age sex ratios between 2000 and 2020. The highest-value points are plotted on top to emphasize extreme values. Credit: Nature Cities (2026). DOI: 10.1038/s44284-026-00447-7
The world's urban population increased by 785 million people between 2000 and 2020, but that tells only part of the story. Now, a research team including an expert from the University of Michigan has dug into the demographics of more than 10,000 individual cities to obtain insights that can be lost in the aggregate. The findings are published in the journal Nature Cities.
"Our results show that national averages obscure substantial differences between cities and that globally consistent city-level demographic data can provide important insight for urban planning, climate adaptation and development," said Nina Brooks, an author of the new study and assistant professor at the U-M School for Environment and Sustainability.
How cities are growing and changing
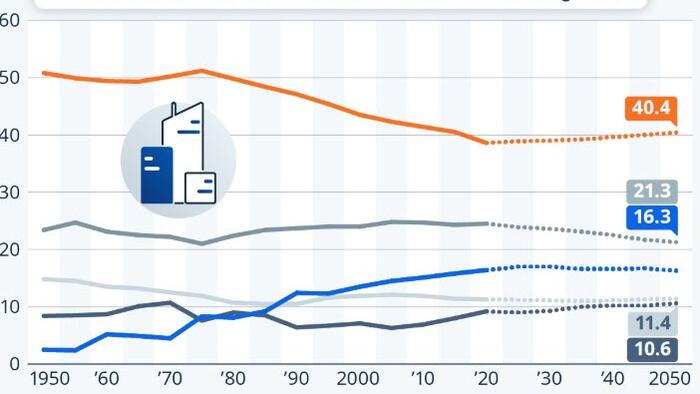
The team's analysis reveals that from 2000 to 2020: