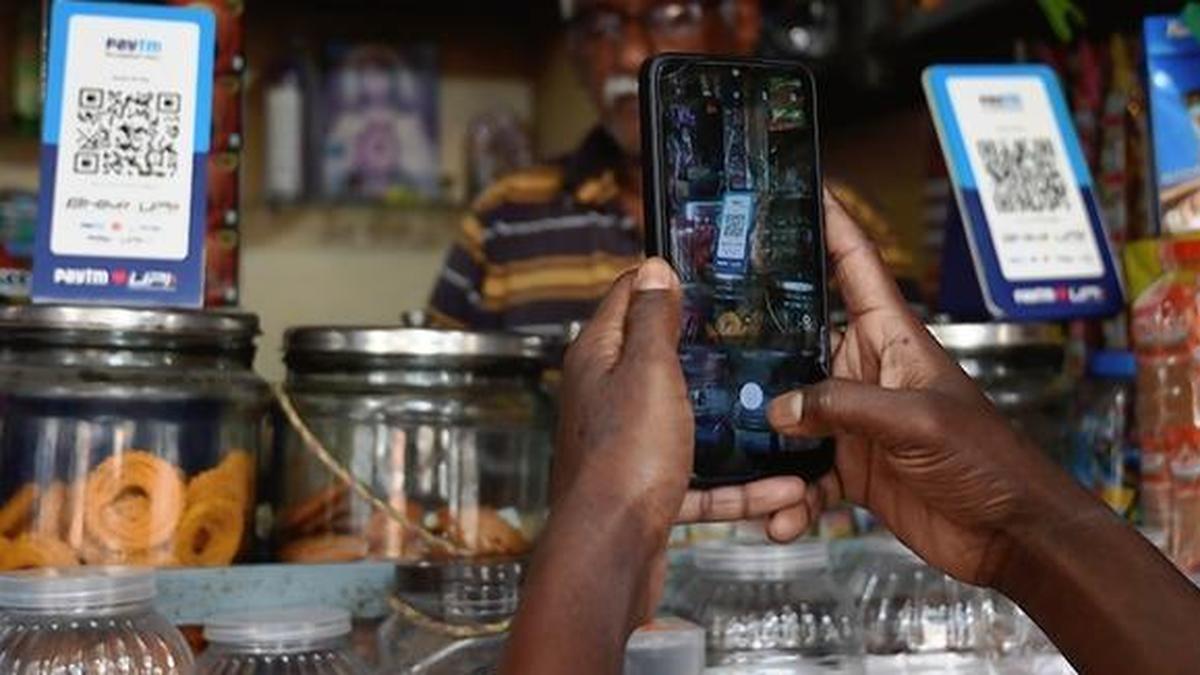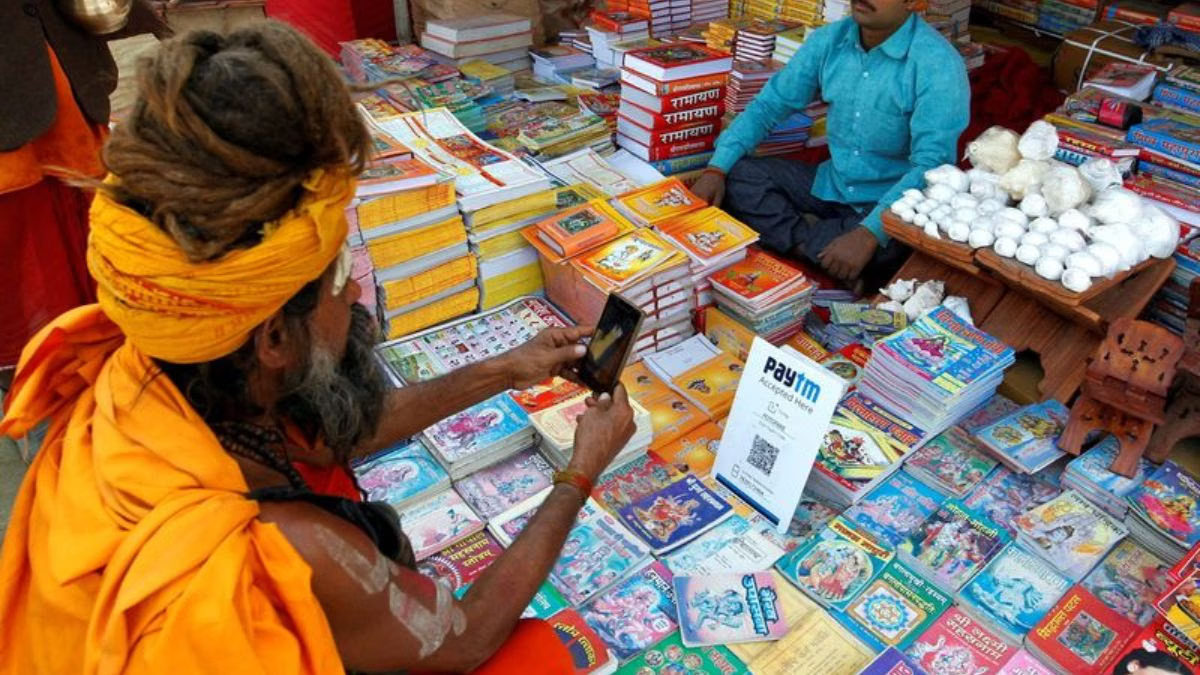
Buying vegetables or paying a rickshaw driver 10 years ago meant paying in cash. Today, however, a QR code does the job, and every transaction leaves a data trail. India’s Unified Payments Interface or UPI now processes more than 18 billion transactions a month, with the total transaction value surging from Rs 7,000 crore in Financial Year 2016-17 to approximately Rs 314 lakh crore in Financial Year 2025-26, marking a more than 4,000‑fold increase.
Yet this dataset is largely treated as a payments metric or numbers for budget speeches rather than a widely used high-frequency economic indicator. That is a missed opportunity, and an increasingly costly one.The case for treating UPI intensity (monthly transaction value as a share of state domestic product) as a serious economic indicator rests on a simple intuition. If an economy is active, money moves. And in India today, money increasingly moves through UPI, whose share in digital payments has surged from 34 per cent in 2019 to over 83 per cent in 2024.
Unlike the Index of Industrial Production, which captures only manufacturing, or Purchasing Managers’ Index (PMI) surveys, which sample a fraction of firms, UPI flows cut across agriculture, services, retail, and B2B activity simultaneously. They update monthly, are not revised, and are granular enough to track regional heterogeneity that aggregate GDP estimates systematically obscure. A growing academic literature on nowcasting India’s GDP has accordingly turned to this high-frequency indicator that provides more timely signals.How UPI data tells a story for every state