This is a submission for the Gemma 4 Challenge: Build with Gemma 4
What I Built
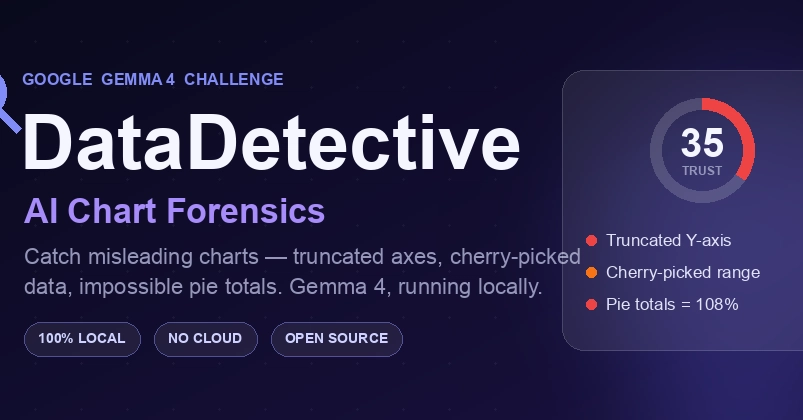
You know the charts that look dramatic but are actually showing a 3% change? The Y-axis that conveniently starts at 95 instead of 0. The 3D pie chart whose slices somehow add up to 108%. The stock line that’s “up 59.5%!” — over a five-month window hand-picked from a bad year.
I see these constantly — news, earnings decks, social posts — and it bugs me every time. So I built DataDetective: drop in any chart image and Gemma 4 gives you a forensic breakdown — what manipulation tricks are in play, an integrity score from 0–100, what the chart actually shows vs. what it wants you to think, and how to fix it.
The whole thing runs locally through Ollama. No API keys, no cloud, nothing leaves your machine — which matters when the thing you’re analyzing is an internal financial chart or a competitor’s deck.