TL;DR — We just launched Application Metrics, a new way to track critical signals in your application. It lets you understand your users with context and catch problems before they become errors.
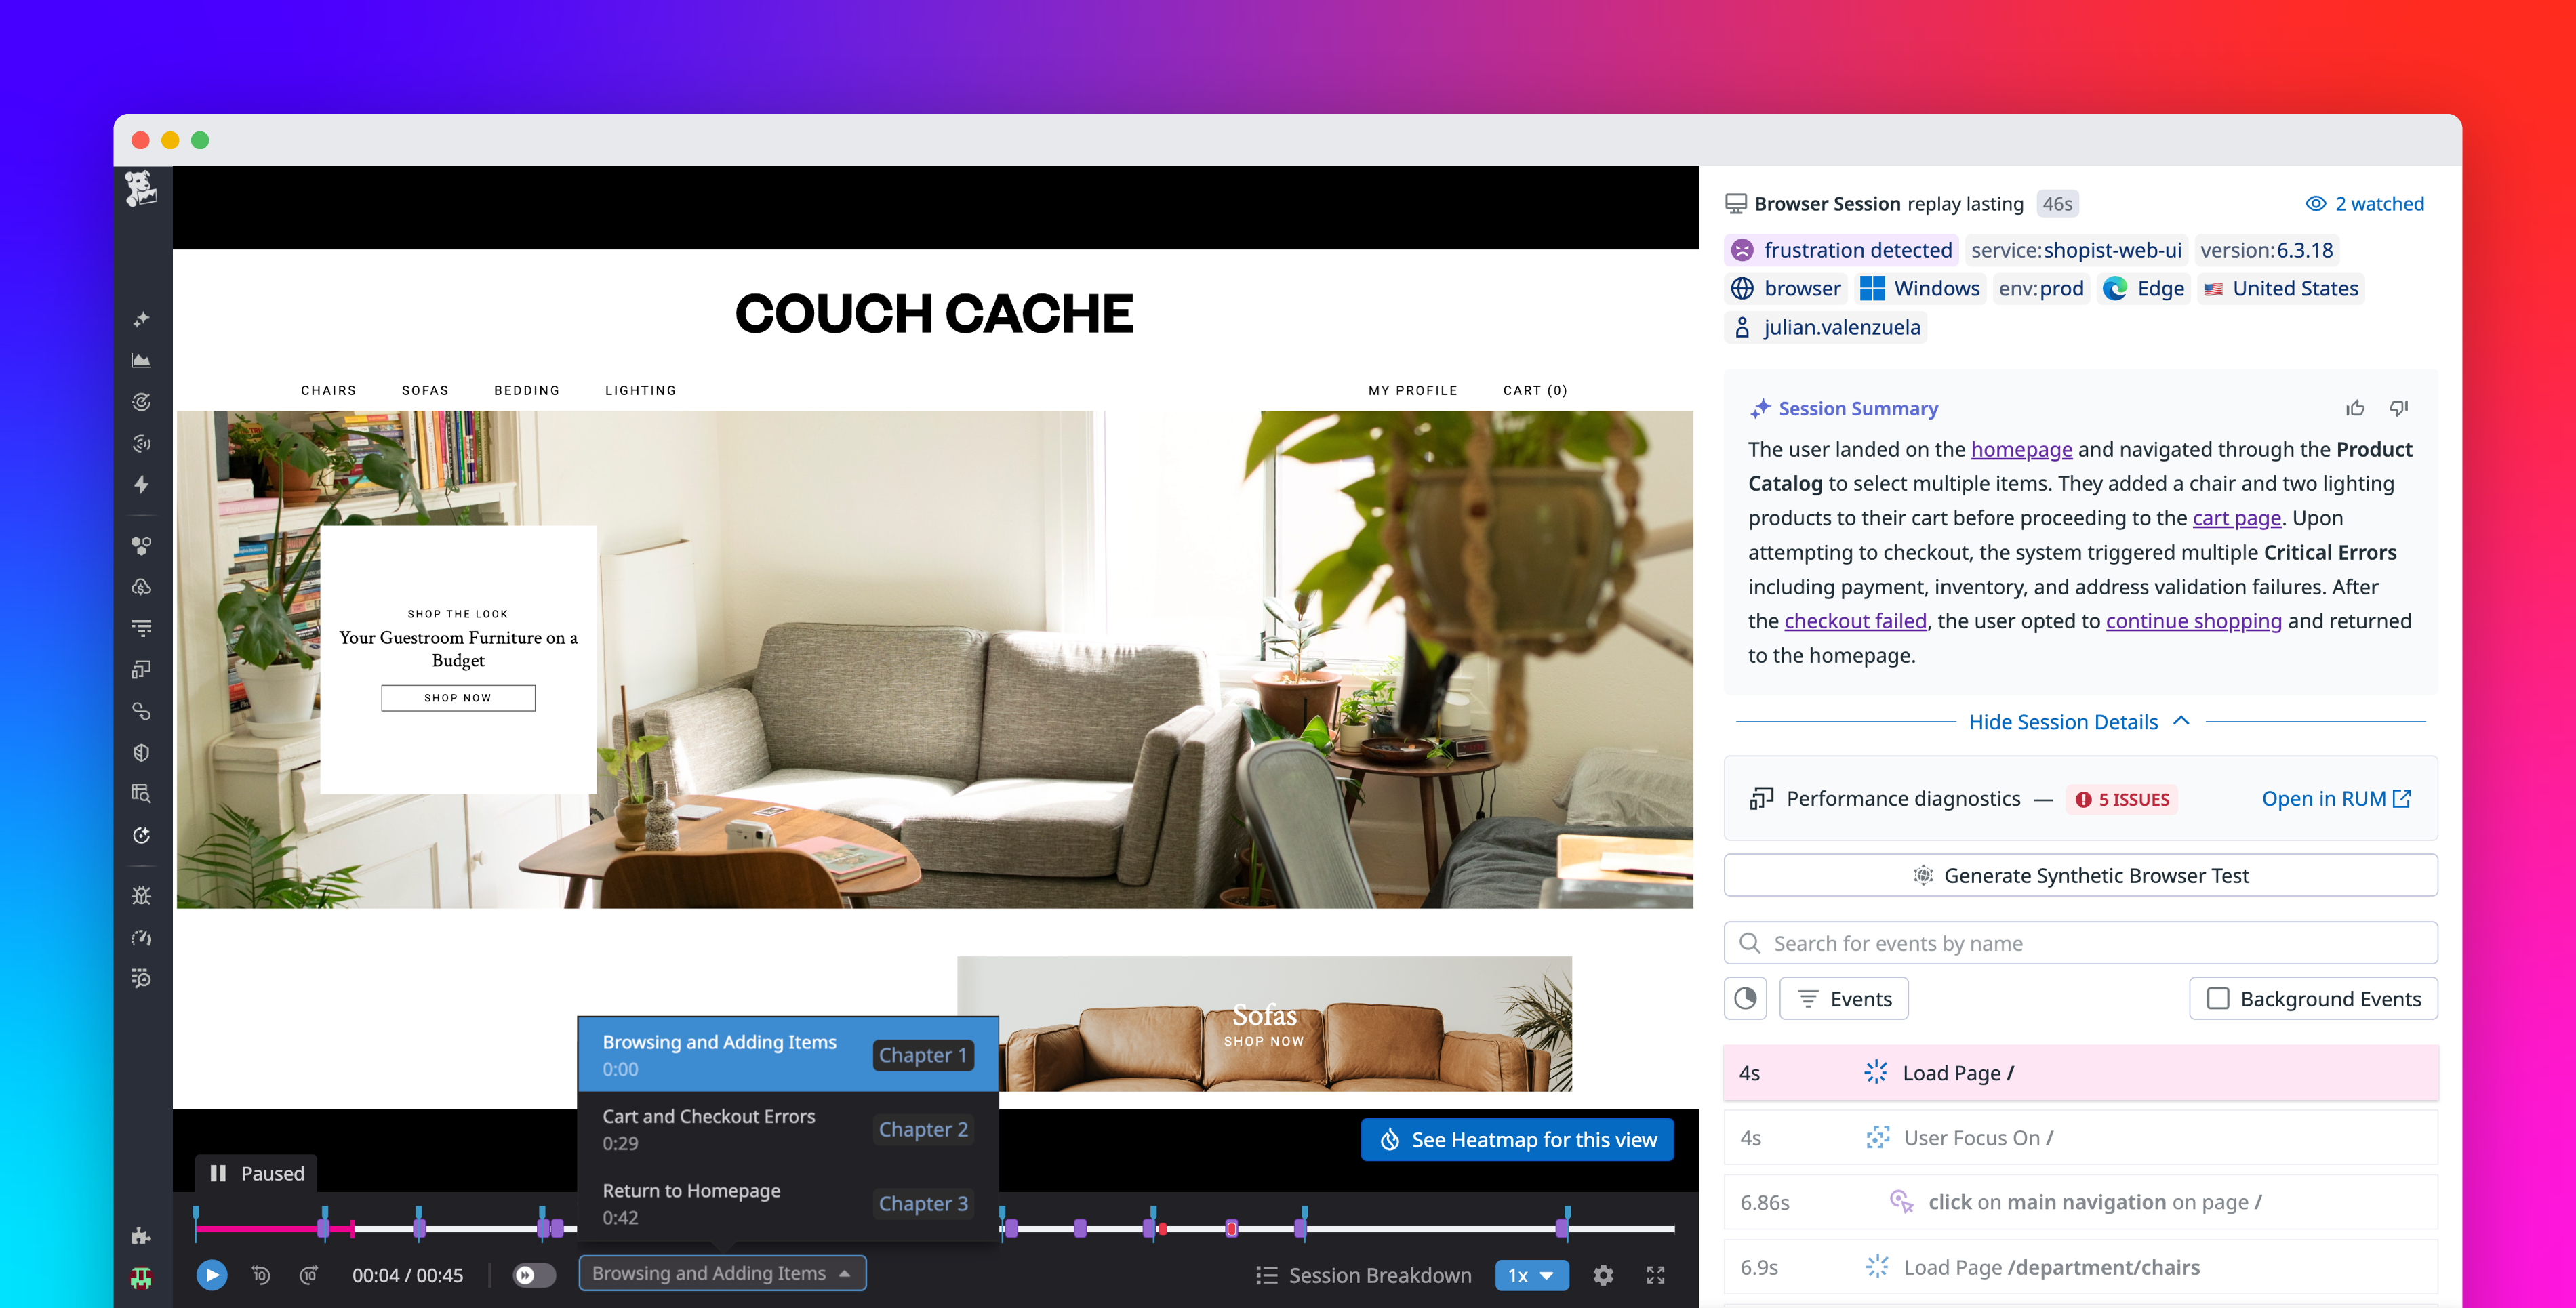
A few weeks ago we had a bug with Session Replay. Replays were failing in some browsers once more than 1,000 video segments loaded. We had no idea how often it happened or who was hitting it, and because the failure didn’t always produce an error, we had no way to find affected users to reproduce it.
Before, we could’ve answered this with spans or logs, but it’s clunky — spans are often sampled, so you can miss outliers; logs are less structured and tend to change over time. Both are better suited for investigation. Metrics are ideal for tracking known behaviors over time. So we set up a metric in the Sentry SDK with a user and provider attribute, filtered for sessions over 1,000 segments, and had a repro case in minutes.
That’s the job Application Metrics is for: track the signals you care about, and attach the context you might need later. When something breaks, the data is already there waiting.
Full events, not pre-aggregated counters