Data availabilityHigh-resolution geospatial data describing individual solar PV facilities and wind turbines cannot be publicly released owing to sensitivity associated with critical energy infrastructure. Aggregated county-level hourly solar and wind generation time series used in the complementarity and penetration analyses, together with processed provincial load profiles, are publicly available at Zenodo (https://doi.org/10.5281/zenodo.19079543)59. Example geospatial vector data for wind turbines and solar PV installations in Qinghai province are also provided as an illustrative subset of the detection dataset. High-resolution satellite imagery used for facility identification was mainly accessed through Google Earth for non-commercial academic research. Further data supporting the findings of this study may be available from the corresponding author on reasonable request and subject to institutional approval. Source data are provided with this paper.Code availabilityScripts used to reproduce the county-level complementarity analysis and provincial penetration analysis are publicly available at Zenodo (https://doi.org/10.5281/zenodo.19079543)59. Wind turbine detection and PV installation segmentation were implemented using the open-source frameworks mmdetection and mmsegmentation. Configuration files specific to the deep learning experiments conducted in this study are provided in the same repository.ReferencesGrams, C. M., Beerli, R., Pfenninger, S., Staffell, I. & Wernli, H. Balancing Europe’s wind-power output through spatial deployment informed by weather regimes. Nat. Clim. Change 7, 557–562 (2017).Article
Advancing solar and wind penetration in China through energy complementarity - Nature
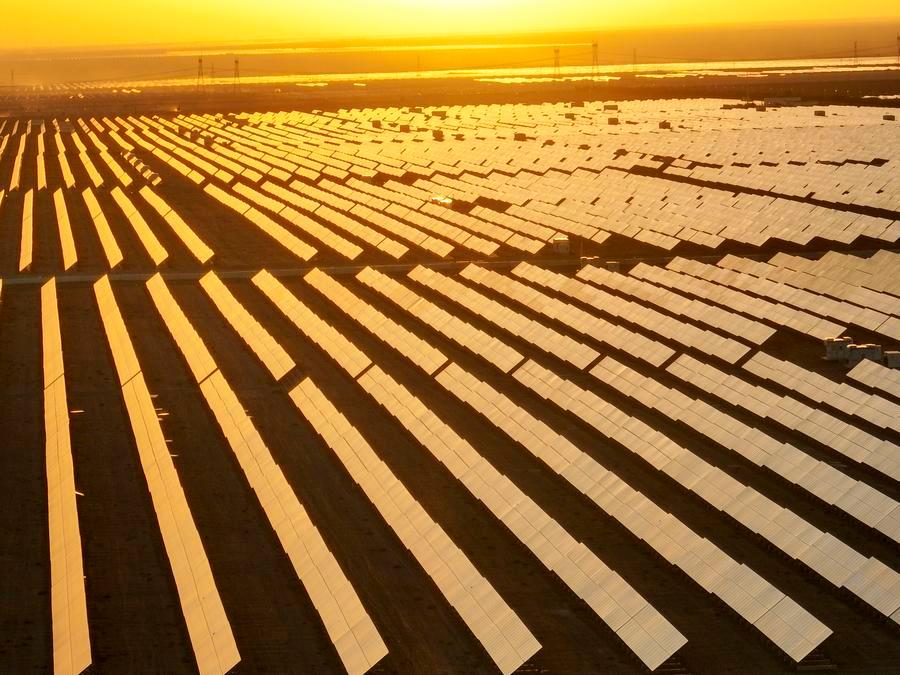
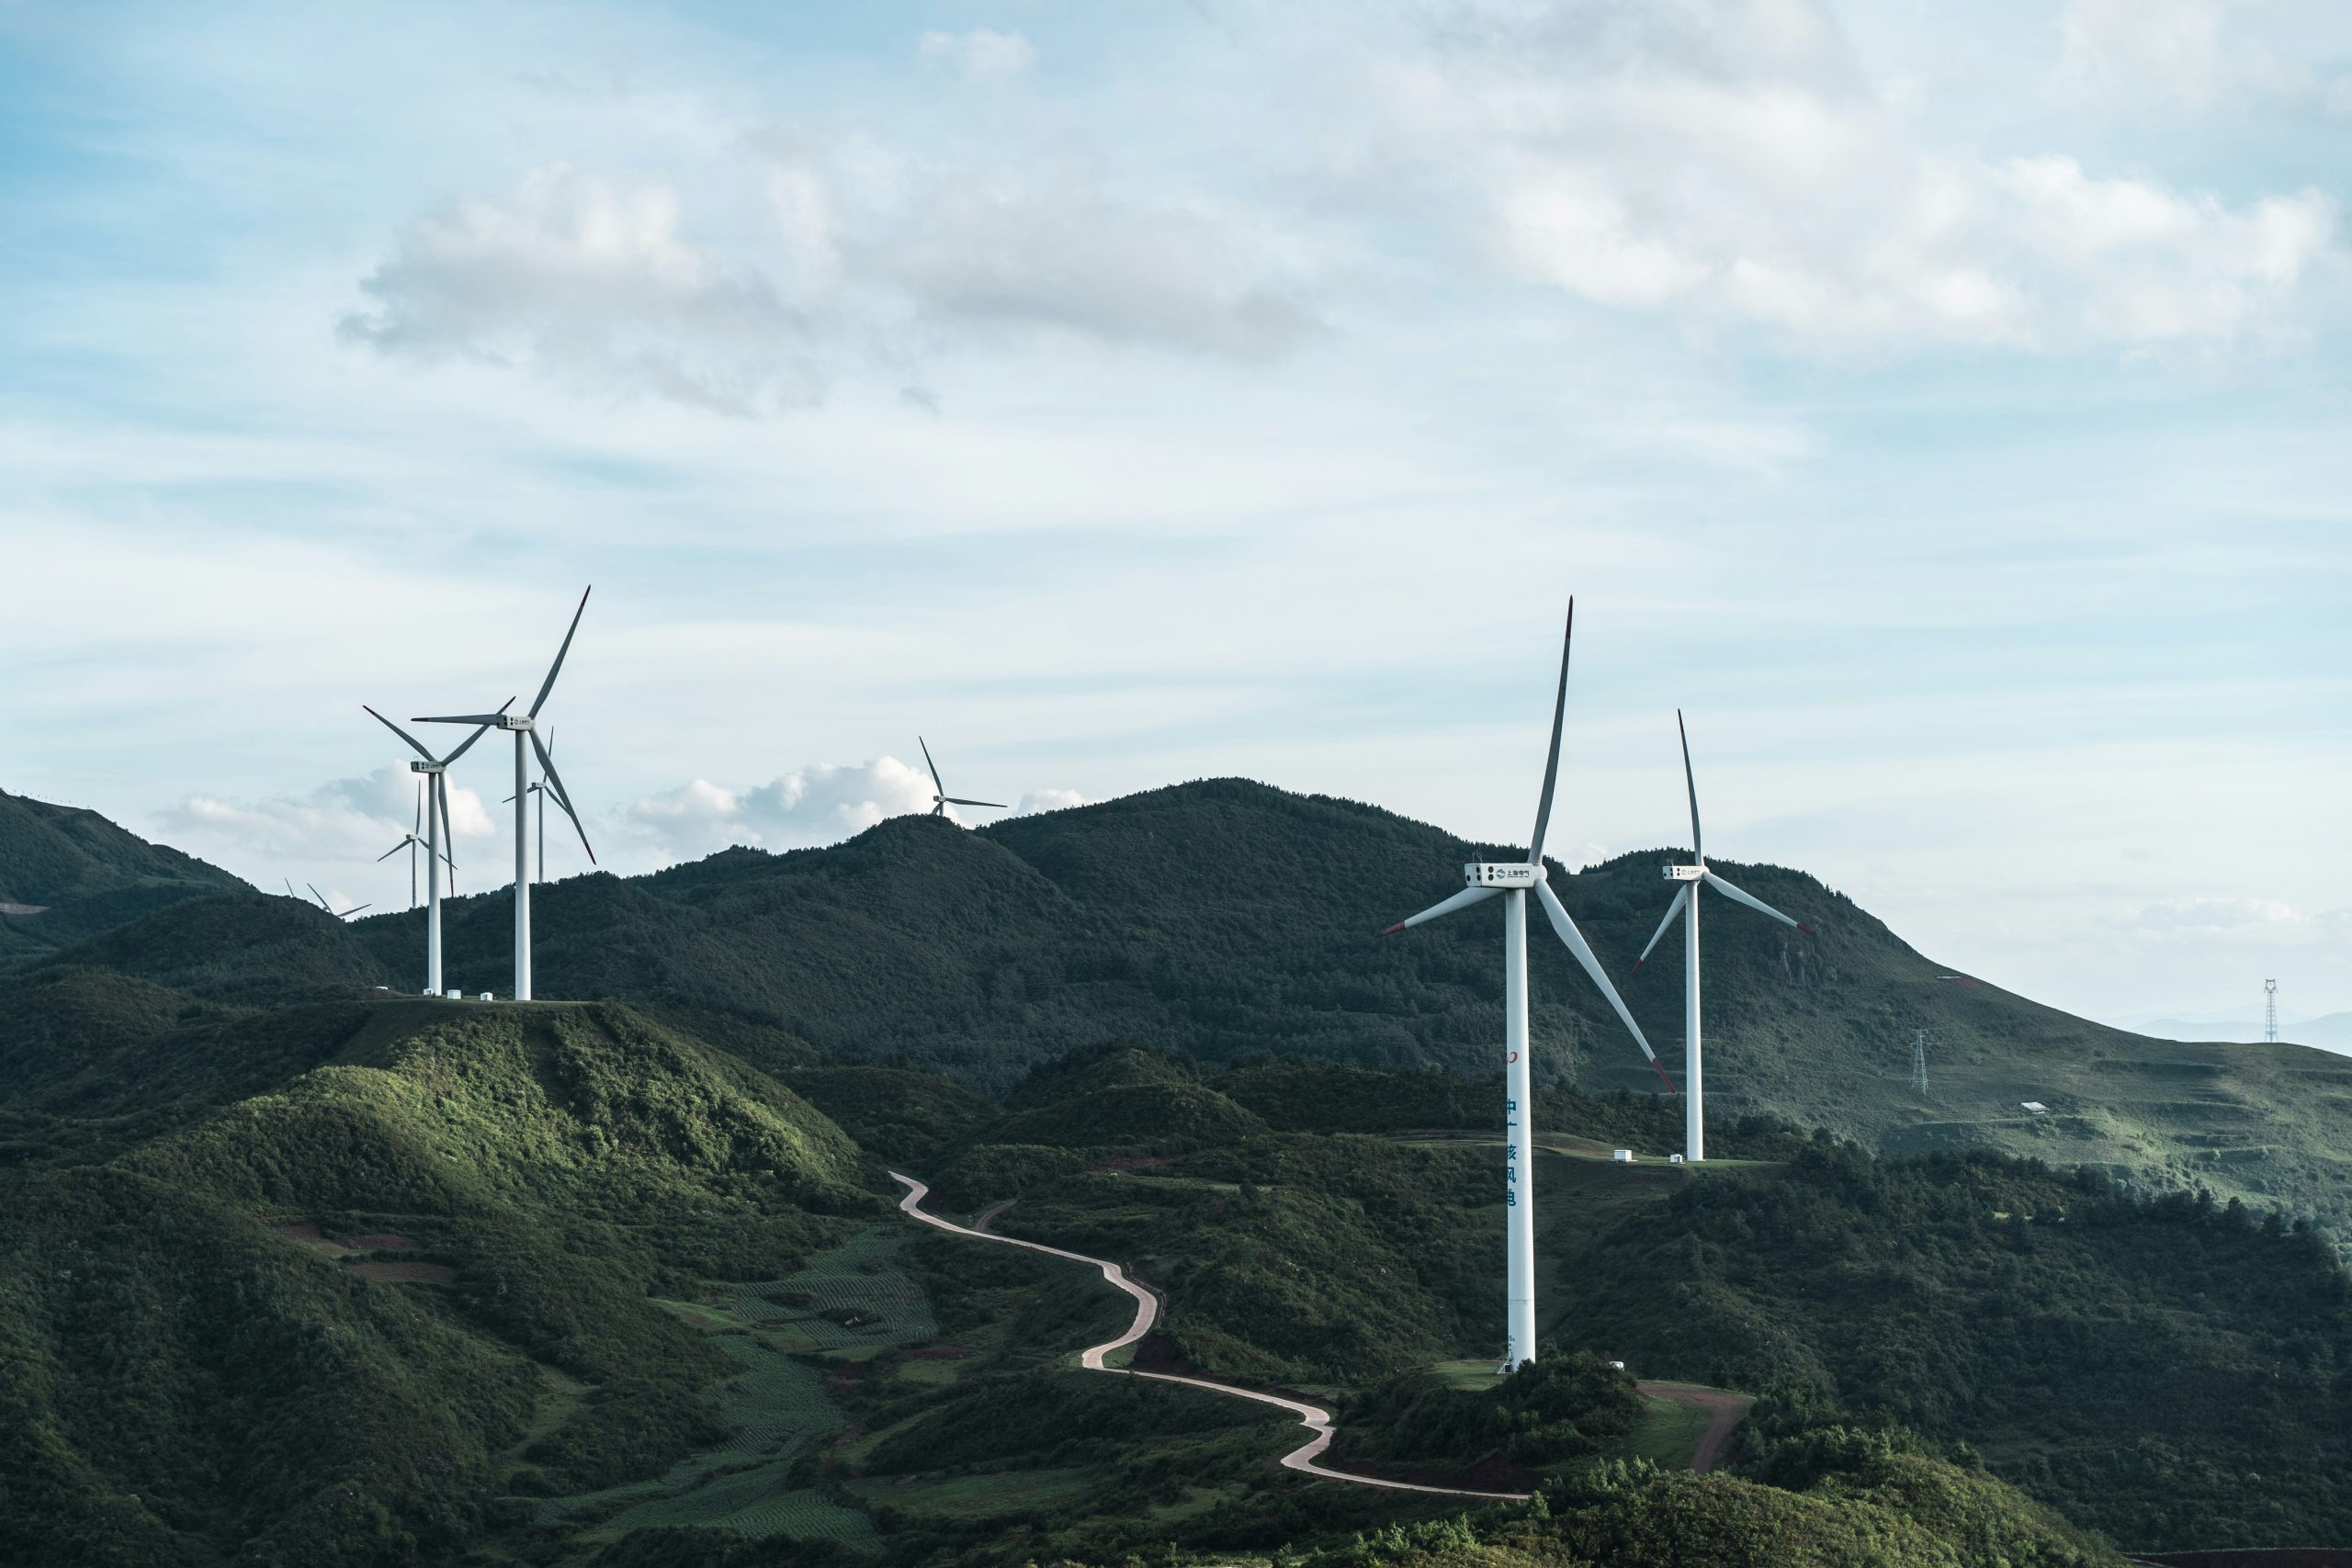
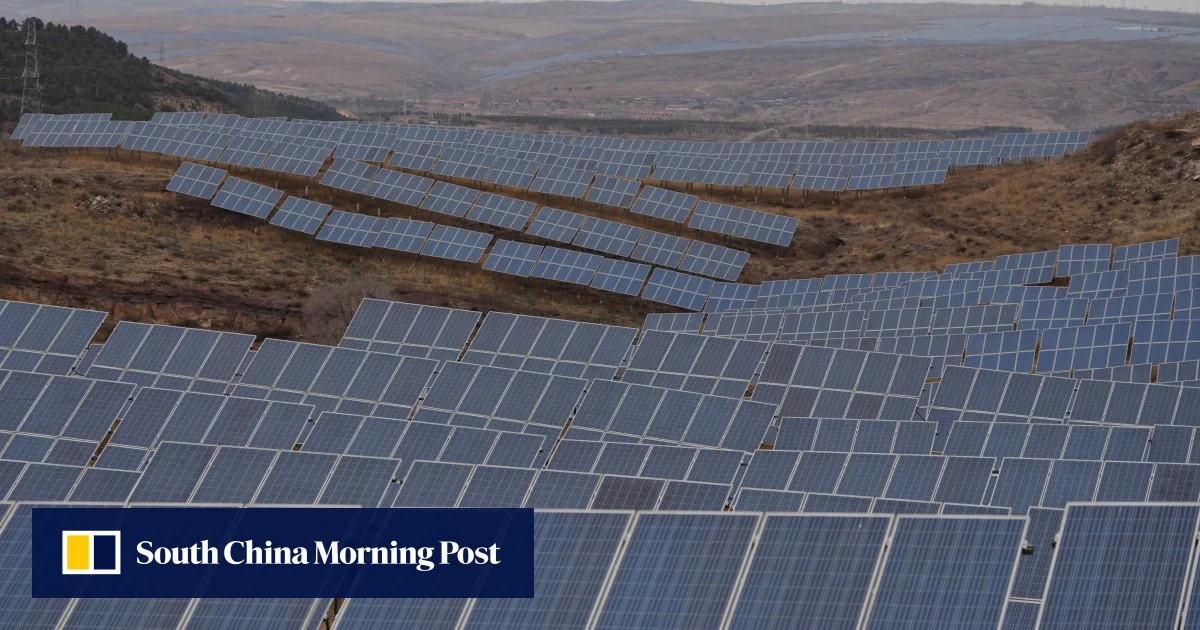
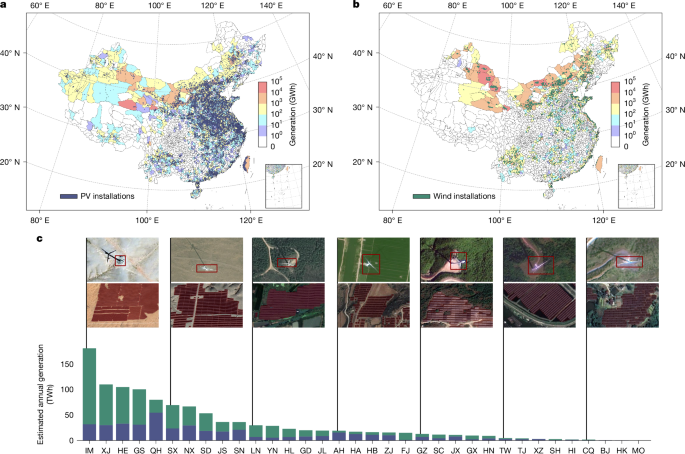
Using high-resolution satellite imagery combined with a deep-learning-based framework to build a national energy inventory enables a data-driven assessment of solar–wind complementarity strategies to reduce power variability and enhance renewable energy penetration across China.
3,060 words~14 min read