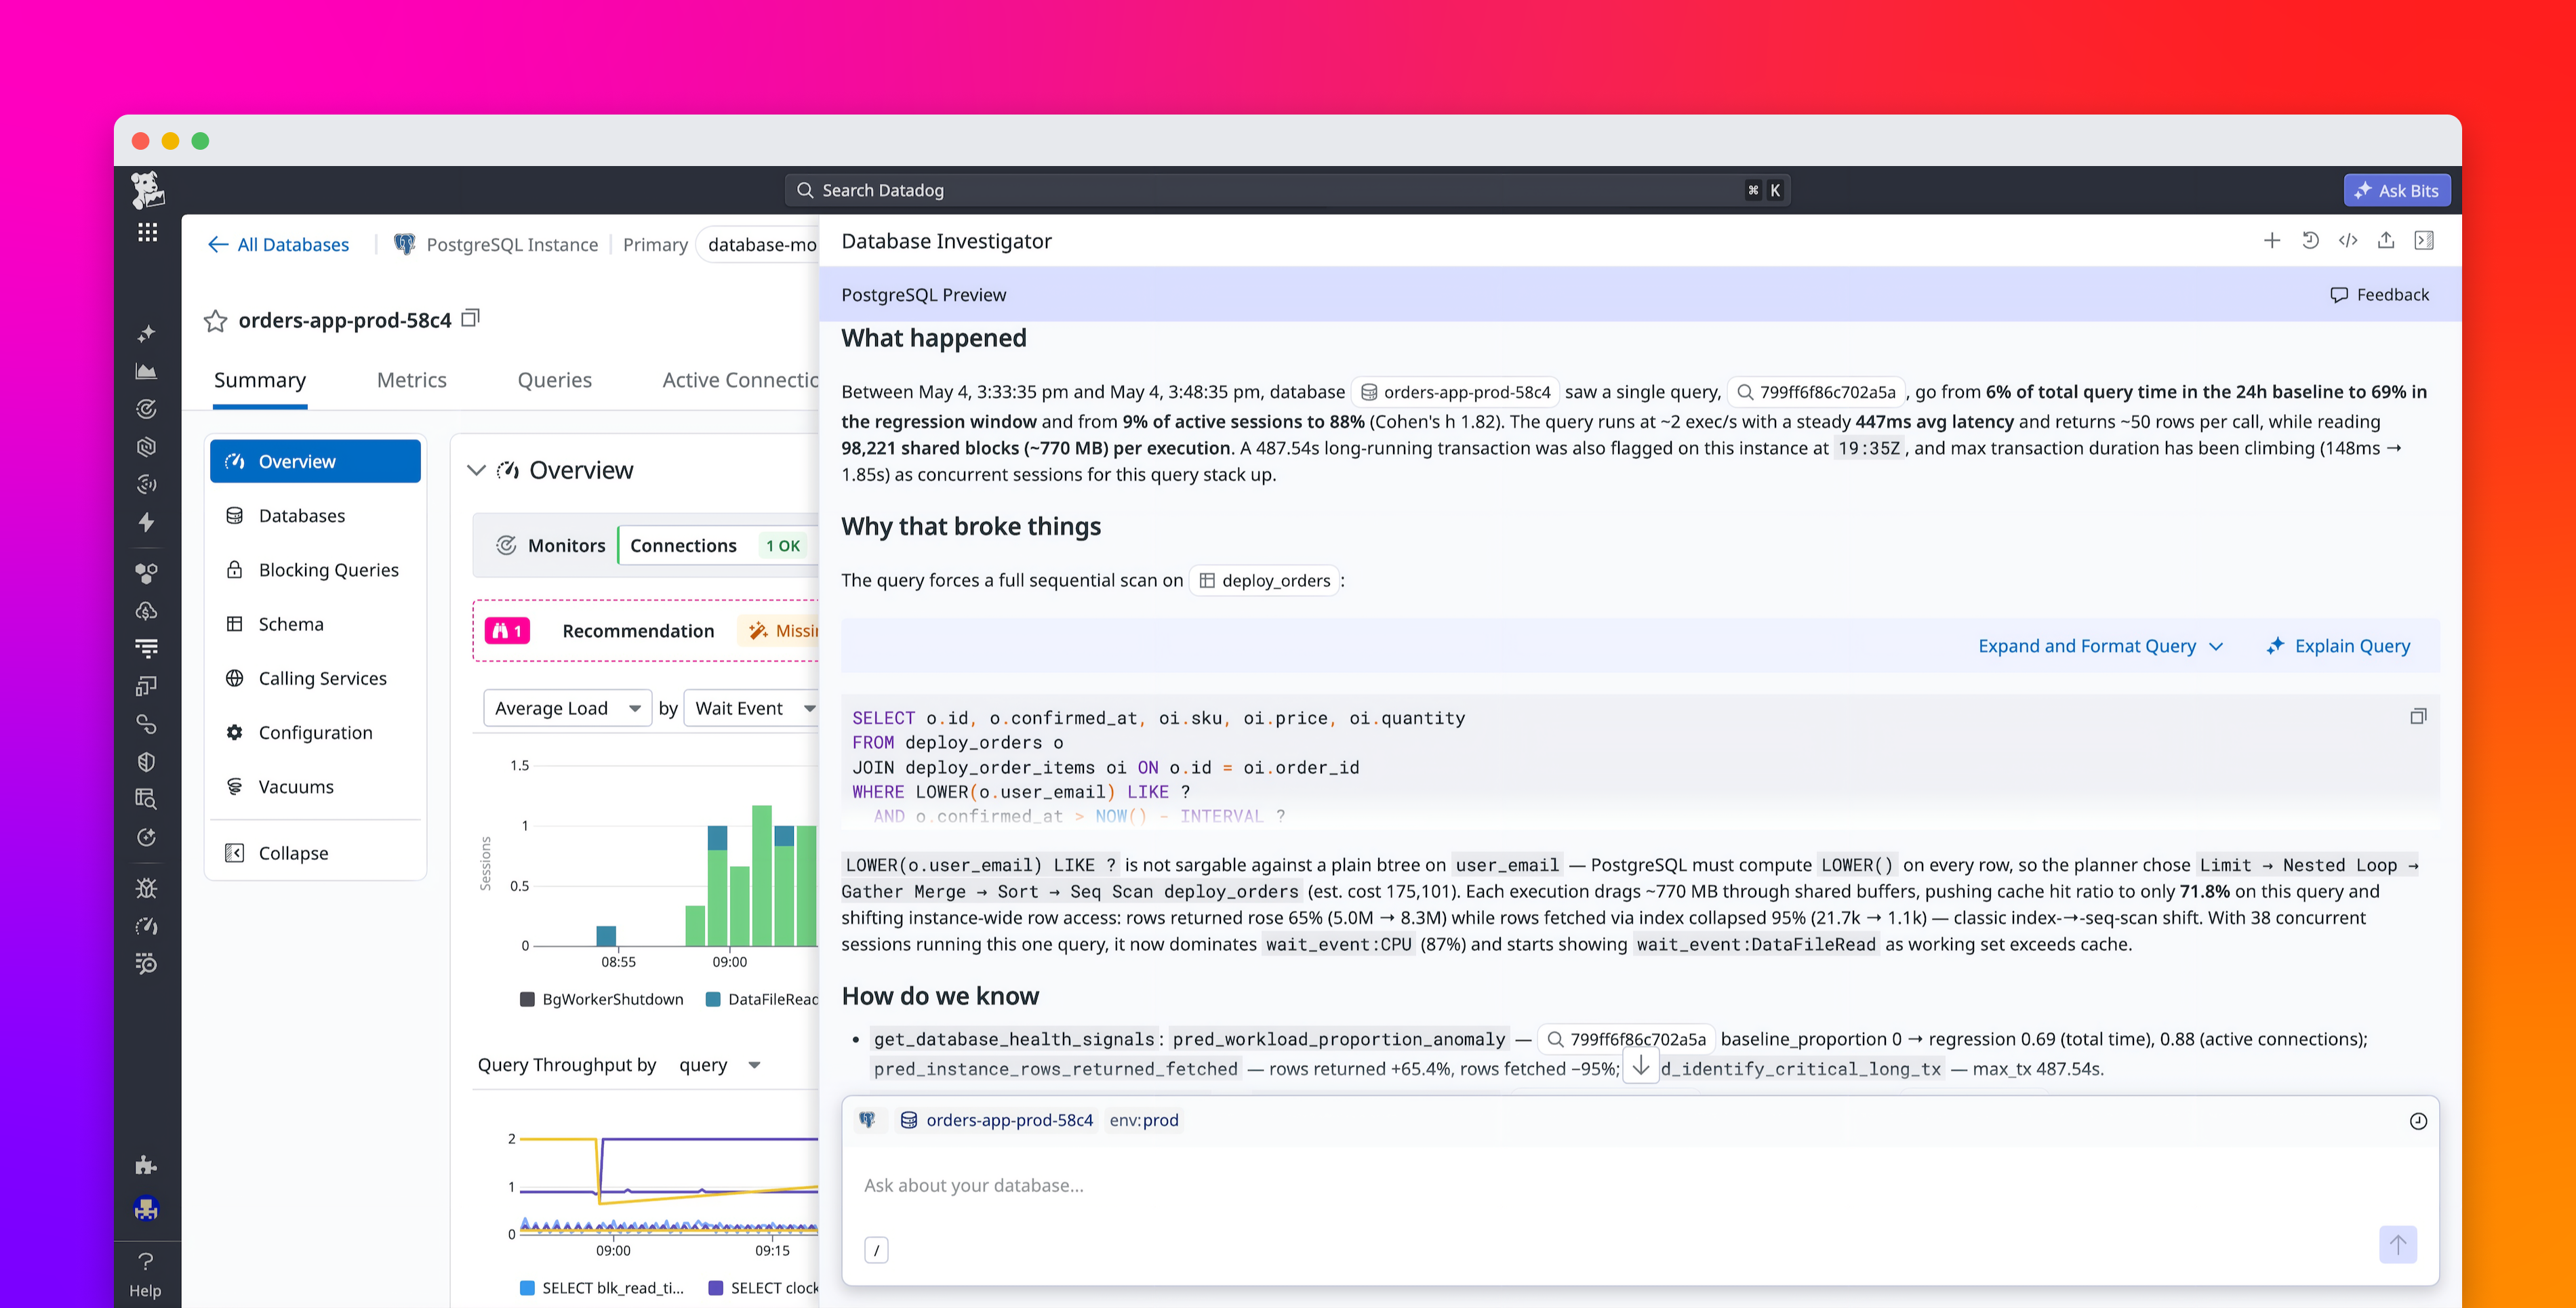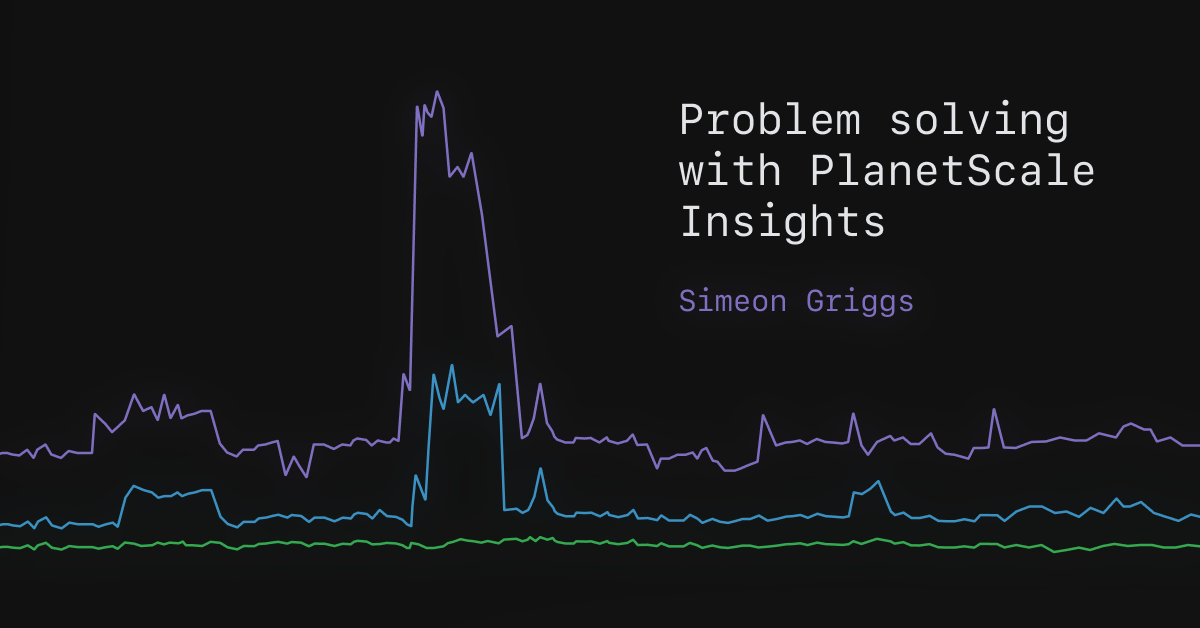
Simeon Griggs [@simeonGriggs] | May 7, 2026There are so many ways your database can disappoint you. It'll make your application perform in ways you don't expect and upset your users.In a sufficiently complex application, finding and eliminating performance problems can be difficult. Fortunately, PlanetScale gives you the tools to isolate the problem. PlanetScale Insights, available in the dashboard and through the MCP server, provides accurate, up-to-date information on how the queries in your codebase perform in production.But with so many different metrics available, how do you differentiate good numbers from bad, signal from noise, or know what the most likely fix is once you've pinned down the problem?For this post, I'll walk through exploring Query Insights for a demo e-commerce app connected to a PlanetScale Postgres PS-10 database with a few million rows of data. I set up a flow of constant, regular traffic along with a few "unexpected" spikes.PlanetScale Insights also works for PlanetScale Vitess/MySQL databases and has many of the same features. This post focuses only on PlanetScale Postgres.Latency timeline graphThe default view of the PlanetScale Insights dashboard shows query performance, counts, and row reads and writes for the past 24 hours. You can navigate through up to seven days' worth of traffic data.Query latency is the best starting point for isolating query performance issues. You can toggle trend lines in the graph on and off; the query list below aligns with the same timeline.On this page, latency percentiles are computed from all query pattern executions performed within the observable time window. How fast most runs are versus the slow tail. That is how you differentiate the median run (p50) versus the worst few percent (p99 and above).p50: Half of this query's executions complete faster than this value, half slower. This is the median latency for that pattern.p95: 95% of executions complete faster than this; only 1 in 20 are slower. This filter identifies patterns that occasionally misbehave, but tuning them often will not move overall database latency (for example, workload p50) very much.p99: 99% of executions complete faster than this; only 1 in 100 are slower. This is where gains can be made for that pattern's worst runs.p99.9: Only 1 in 1,000 executions are slower. These are usually extreme outliers for that pattern: lock contention, cold caches, missing indexes, table scans, and similar.Max: The single slowest execution of this pattern in the time window. Useful for spotting worst-case scenarios, but a single anomaly can skew this number and may be related to an almost random event that never reoccurs. Always compare it against the percentiles above.For a deeper dive on understanding latency percentiles, watch Ben's video.Given this screenshot of Insights from my example application, the tabs at the top show that at 12:05 GMT+1 the p50 is 1.4ms and the p99 is 2s.Point-in-time performance numbers can be useful, but execution trends over time matter much more to find real, unexpected outliers.From the graph we can see the p99 is consistently far higher than the p50 and p95, with one huge spike where it got as high as 12s.Generally, you may think that if "only" 1/100 queries are slow this latency may have a limited blast radius. But if a page load in your application triggers 10s or 100+ queries to your database the impact could be widespread and affect more users than you think.These slower p99 queries we need to find and resolve. Let's find the guilty parties.Query listBelow the latency graph, filtered to the same timeline, is a list of queries. From here, you can investigate the performance of each individual query that was run on your database at the same time. There are many columns of data you can read to investigate query performance. Which data is useful to you will depend on what you're debugging.If you're not sure which numbers to look for, the tabs on the top right have preconfigured columns.For example, if your database consistently shows high CPU usage, click the "Resources" tab to view CPU usage metrics. You can click any column to sort by that metric.Since we're looking to fix query latency, we'll click the Performance preset and sort queries by p99 latency (ms).Note that the Performance preset also includes the "Rows read/returned" column; this is often the simplest identifier of slow queries. It contrasts rows the engine had to read with rows actually returned—when reads are high but returns are low, the database is doing a lot of work per useful row, often because of missing or unsuitable indexes. Most often, these queries can be fixed with an index.Solving the response time issues for some of these queries will be simpler than for others. A number of these queries have a little (i) information icon beside them showing that the queries are being performed without an index and may benefit from one.(It's also worth noting that some of these queries are slow because they're deliberately bad queries. I needed an exceptionally unoptimized application for this blog post. So, for example, we're not going to "fix" a query for a random product ID.)Searching for queriesThe search box above the query list lets you perform targeted searches for specific queries. You may write part of an SQL query in this box, but there are additional search syntaxes to query by feature, latency, tag, or more. Examples include:indexed:false — find all queries not using an indexindex:table_name.index_name — find all queries using a specific indexp50:>250 — filter by latency thresholdquery_count:>1000 — filter by execution counttag:key:value — filter by tagClicking the SYNTAX button on the right side of the search box reveals the full set of filters you can use to narrow down your query filtering.Other graphsAlong with Query latency there are graphs to show other activity trends in your database.The Queries tab shows total queries per second over time. If latency rises at the same time as query volume, you may be looking at a traffic spike rather than a single query pattern getting worse.The Rows read tab shows how many rows the database reads per second. High rows read, especially compared to rows returned in the query list, can indicate that the database is reading unnecessary rows and may benefit from a better index.The Rows written tab shows rows written per second over the selected time period. It gives you a separate view of write volume alongside query latency, query count, and rows read.Query detailsLet's click in to look at an individual query and what Insights can tell us.If your application writes raw, sensible SQL, your query might look as simple as this:If you're using an ORM, your query could be incomprehensible at first glance. Fortunately, the "Summarize query" button runs the query pattern through an LLM to describe its purpose in plain English.You may also notice the query has been anonymized. Because parameters in a query may contain sensitive information, they're replaced with placeholders when logged in to Insights. In this instance, the search term %turbo% is rendered as the parameter $1, but it is not visible in Insights.The page of a query pattern also contains a table of notable queries, individual executions that took longer than 1 second, read more than 10,000 rows, or produced an error. This could help determine whether your query is not always slow and perhaps reveal a common time when it runs slower than normal.Taking action on a queryOn this page, you can see the same performance graphs as the query list page, but isolated to just this one query. In this screenshot, we see a recommendation from Insights to add an index if the performance is poor. A lot of the time, this is a great idea.Unfortunately, because this query is using a wildcard search, a BTREE index won't help.If the query were simpler, like below, an index on the name column would greatly improve performance.select count(*) as count from products where name = 'turbo';
Problem solving with PlanetScale Insights — PlanetScale
The best way for you and your agents to see how your database actually performs in production.
2,532 words~12 min read