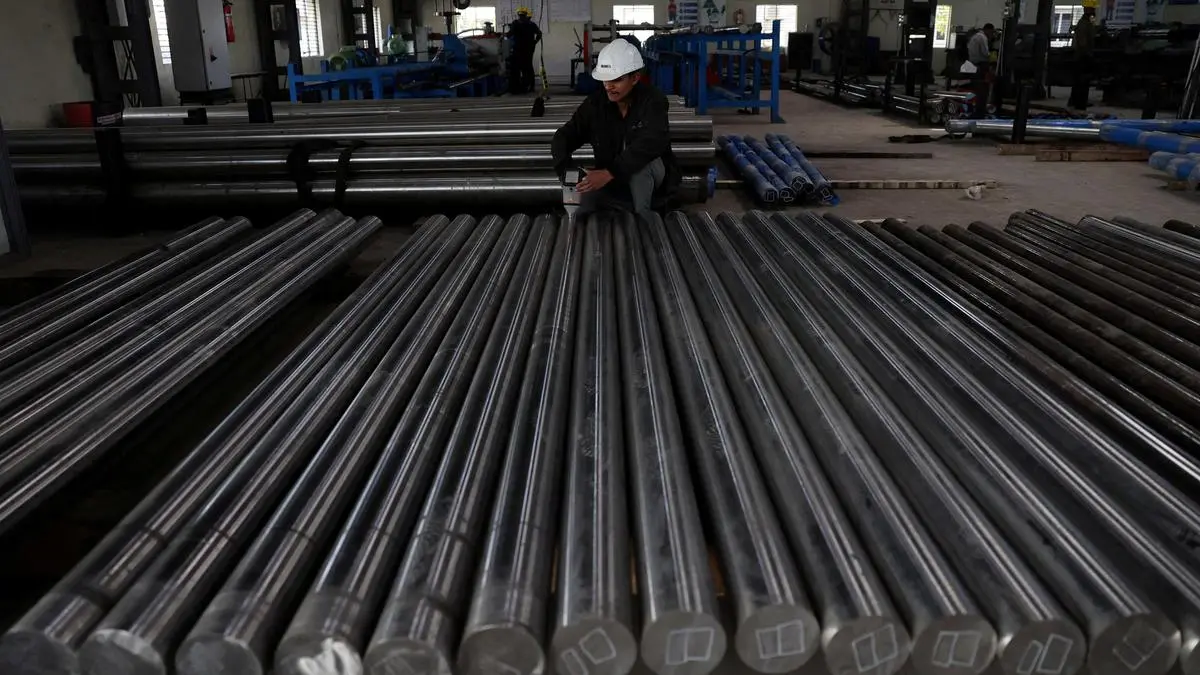
The strong performance of the corporate sector is reflected in corporate tax collections as well as GST collections
| Photo Credit:
There has been a healthy discourse on the quality of India’s GDP statistics. This phenomenon has persisted for years now, each time there is a statistical base-year revision or whenever the latest quarterly print is released. What is an even bigger positive is that the debate is no longer just confined to analysts and policymakers but has also spread across daily discourse among individuals. This reflects not just greater awareness but also growing interest in the bigger picture facing the Indian economy.The Q1FY27 GDP print was released against the backdrop of the West Asia crisis, with the Indian crude basket averaging $101 a barrel. India imports more than 80 per cent of its crude oil and gas consumption and is the world’s second-largest net crude oil importer. As if the volatile global backdrop wasn’t enough, even the weather was unpredictable, with an unprecedented heatwave and an extremely weak start to the monsoon in June.Despite these challenges, Q1FY27 real GDP growth pleasantly surprised on the upside at 7.8 per cent vs 8.6 per cent in Q4FY26. Given the challenging backdrop, the buoyant growth numbers have naturally created a lot of buzz. Moreover, the change in GDP methodology has thrown up some interesting outcomes on the deflator front. We try to address some of these issues.GDP growthIs GDP growth 2.6 per cent or 7.8 per cent in Q1FY27? This comparison is wrong on two fronts. First, 2.6 per cent refers to nominal GDP growth calculated as Q1FY27 of the new base GDP over Q1FY26 of the old base GDP. On the old base year series, nominal GDP in Q1FY26 was ₹86.1 trillion, while on the new base GDP this was ₹80 trillion.It is not correct to mix the two base year series as there have been significant methodological changes. These include a wider set of products and services captured in the new base GDP, reflecting the latest consumption and production trends. Indeed, on the new base GDP, nominal GDP is lower than old base GDP by an average of 3.4 per cent (over FY23 to FY26). This mainly reflects better capturing of the informal sector in the new base GDP, utilizing the latest Annual Survey of Unincorporated Enterprises and Periodic Labour Force Survey.The second issue is that 7.8 per cent is actually real GDP growth on the new base year. Real GDP captures volume expansion, while nominal GDP captures both volume and price effects.The deflatorHow is manufacturing deflator growth negative when commodity prices surged in Q1FY27? The deflator is just the ratio of nominal GDP to real GDP; it’s a derived number. Both nominal GDP and real GDP are estimated separately. The manufacturing sector deflator declined by 1.4 per cent YoY in Q1FY27. This ended up boosting real manufacturing GVA growth to 9.2 per cent, while nominal GVA growth was subdued at 7.7 per cent.At first glance, the negative manufacturing deflator growth might seem strange given that commodity prices had surged during this period due to the West Asia crisis. However, this outcome is due to the double-deflation methodology in the new base GDP. Here, the output and input of a company are deflated separately to arrive at real value added. Separate price indices are utilised to capture differing trends in output prices and input prices.In Q1, there was a surge in input costs such as crude oil prices and other raw materials, but output prices of manufactured products saw a much more moderate pickup. In the old base GDP, a single-deflation methodology was used for the manufacturing sector, which would deflate output and input using the same price index. The double-deflation method is superior as it captures the differing trends between input prices and output prices.The job of real GDP is to capture changes in volume. The 9.2 per cent real GVA growth for manufacturing in Q1FY27 is reflecting the fact that the volume of sales growth outpaced the volume of input growth. The fact that input prices rose significantly faster than output prices should not impact real GVA growth. It should impact nominal GVA growth, and we saw this with a much more subdued growth rate for manufacturing.Overall, nominal GDP growth was more subdued at 10.3 per cent YoY in Q1FY27, reflecting a slowdown in nominal manufacturing sector growth. In the old base GDP, nominal GDP growth would have been much higher due to the deflator impact. Hence, the argument that manufacturing GVA growth has been artificially increased doesn’t hold.Other indicatorsLastly, looking beyond GDP, what are the other indicators telling us about growth? Even if one were to doubt the GDP numbers, there are numerous other high-frequency indicators that can be looked at to get a sense of growth. The most important is listed company performance. In Q1FY27, non-financial, non-government listed companies’ EBITDA growth jumped to 16.9 per cent YoY as per analysis done by the RBI.This compares to 9.7 per cent growth in Q4FY26. Note that these are nominal growth rate numbers. The outperformance was due to much stronger sales growth, which compensated for the rise in input costs. The strong performance of the corporate sector is also reflected in corporate tax collections as well as GST collections.Bank credit is another indicator of the health of the economy. Currently, bank credit growth is tracking at 18.3 per cent YoY as of August 15, 2026. Sectoral details reveal that the strong credit off-take is broad-based across industries, services, and personal credit. Credit quality also continues to improve across banks as well as loan categories.Hence, even when one considers other indicators, they all point towards strong underlying growth momentum despite a challenging global environment.The writer is chief economist, IDFC First BankPublished on September 9, 2026