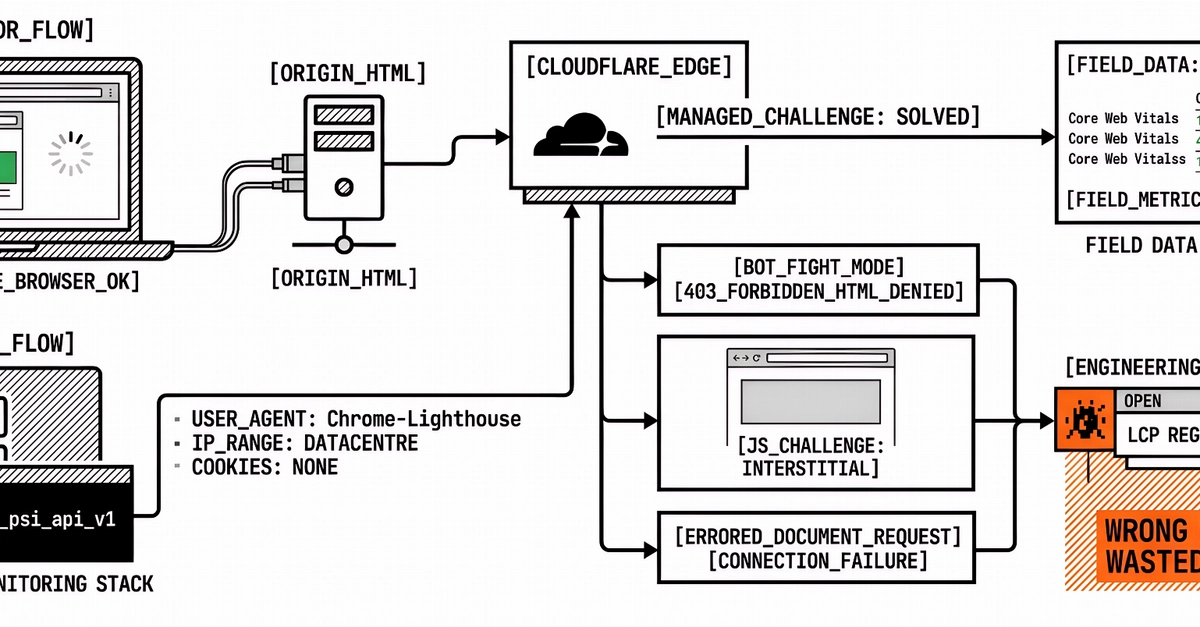
PageSpeed Insights (PSI) answers a narrow question well and a broad one poorly. It is a good reference for how a URL performs under a controlled lab load and, when Chrome UX Report data exists, for how real Chrome users experienced Core Web Vitals on that URL. It is a weak reference for whether your information architecture makes sense, whether your SEO content is complete, or whether yesterday's single green score means the site is fine this week.
Teams get into trouble when they treat the PSI report as a full website audit. The tool measures loading, interactivity, and visual stability signals. It does not certify structure, messaging, or crawl strategy. Knowing that split keeps you from spending a sprint chasing Opportunities that do not move the business risk you actually care about.
What does PageSpeed Insights actually report?
Google's About PageSpeed Insights page describes the product as a report that combines lab data from Lighthouse with field data from the Chrome UX Report when enough samples exist. Lab rows show one instrumented run: device profile, network emulation, and the navigation you triggered. Field rows show rolling percentiles from real Chrome sessions on that origin or URL, typically over a 28-day window.