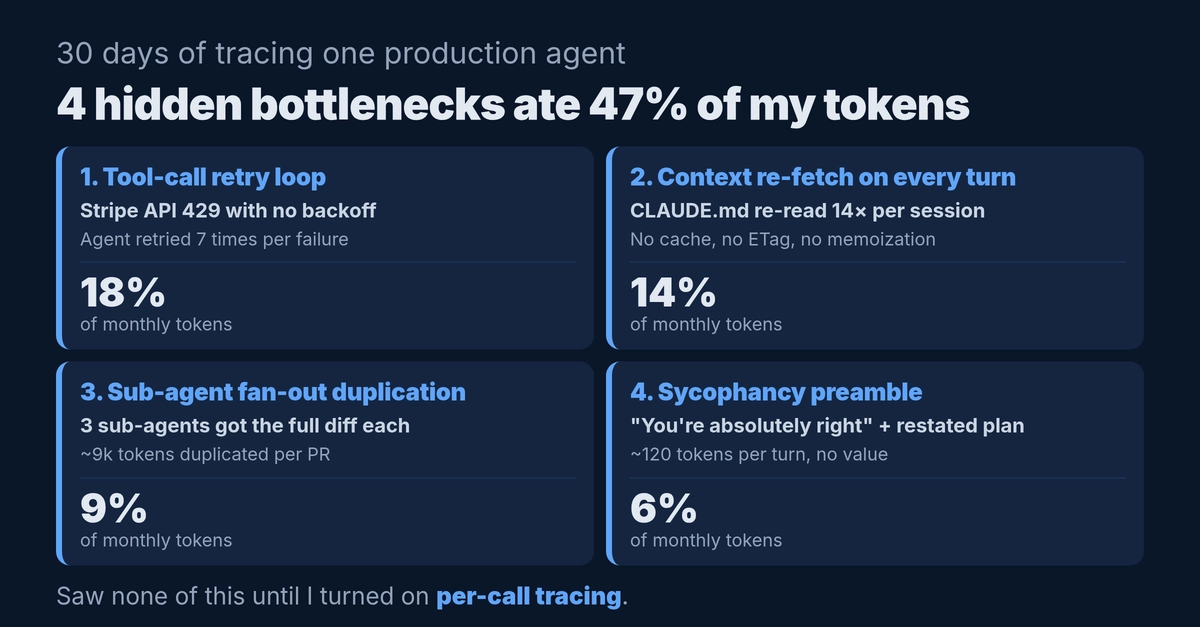
Three in the morning is when a free tier starts lying to you. Your dashboard shows two hundred requests today, yet the token counter says forty percent of your allowance is gone, and the two numbers refuse to reconcile. You check the model's pricing page, then your code, then your logs, and each one points at a different suspect, which means none of them is the real culprit.
The Suspect List
The first suspect is always the model itself, because a free model with a small context window feels like the obvious explanation for unexpected consumption. You swap the model for a cheaper one and wait a day, and the burn rate does not change at all. The second suspect is your own code, so you read every call site and find nothing obviously wrong, because the problem is not in any single call but in how calls accumulate over time.
The Real Culprit
The real culprit is a cron job that summarizes email threads every five minutes. Each run loads the full thread history from the database and sends it to the model, and one particular thread has grown to four hundred messages over three weeks. The job is not doing more work than before; it is doing the same work on a steadily larger input, and the token cost grows linearly with the thread length while your request count stays flat.