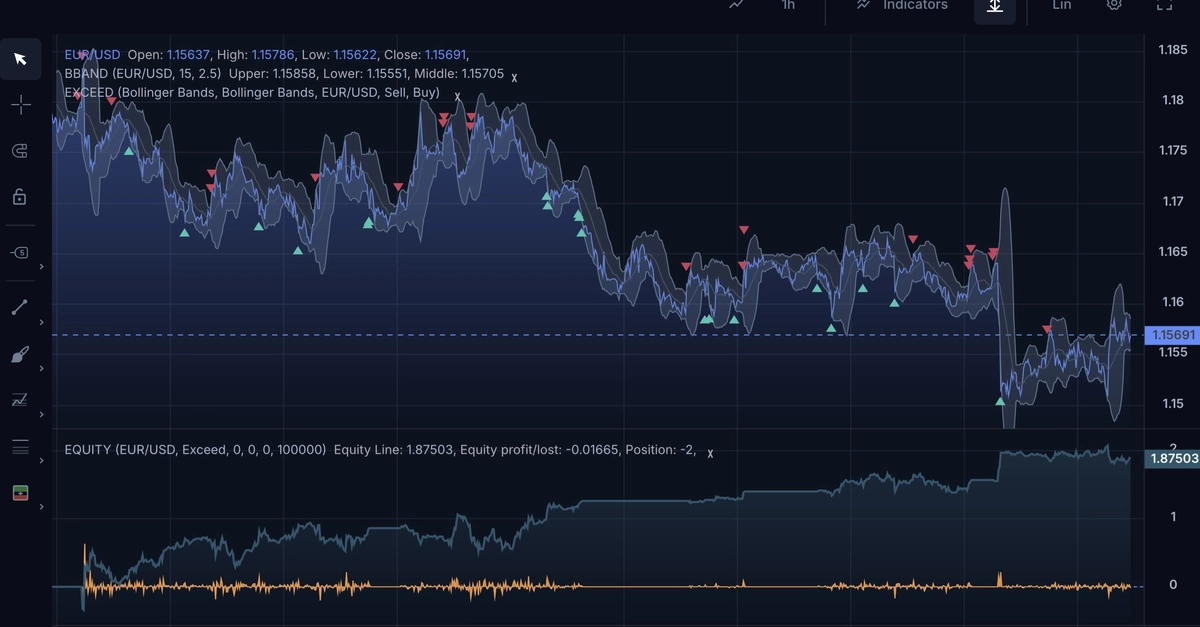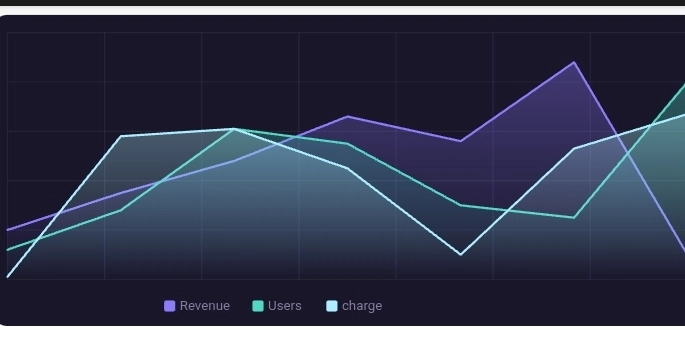
Markdown is great until you want a real chart in a README or docs site. Most people reach for a screenshot, a hosted PNG, or a heavy client library. ProvChart takes another path: POST /api/v1/generate-svg returns a self-contained SVG (and optional data URI) from your data—no js on the page, no image CDN required.
This article covers what different Markdown platforms allow, practical embed patterns, and when pure SVG is the better default.
The idea
Send series data to ProvChart’s SVG endpoint.
Get back: