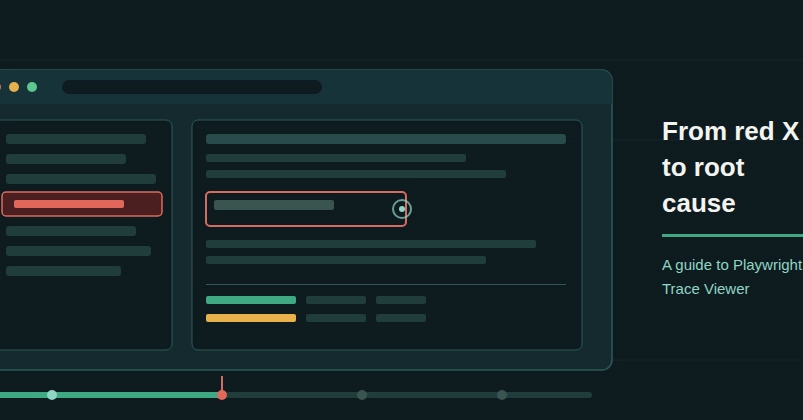
Playwright Trace Viewer is a built-in GUI that records a full, replayable snapshot of a test run — every action, DOM state, network call, and console log — so you can debug a CI failure by opening a file, not by reproducing it.
In practice, that makes a UI test into more than a UI recording. Every browser interaction is synchronized with the underlying API traffic, console output, and page state at the moment it happened — which gives you an API debugging layer for free, without writing a single API test.
That one difference changes the economics of test debugging. This post covers what changes in your day-to-day workflow, how to turn it on, and how to justify it to the people who care about engineering time and CI spend rather than DOM snapshots.
The Problem: Debugging Requires Reproducing
CI fails → Try locally → Can't reproduce → Add debugging → Implement a fix → Push → Wait for CI → Repeat