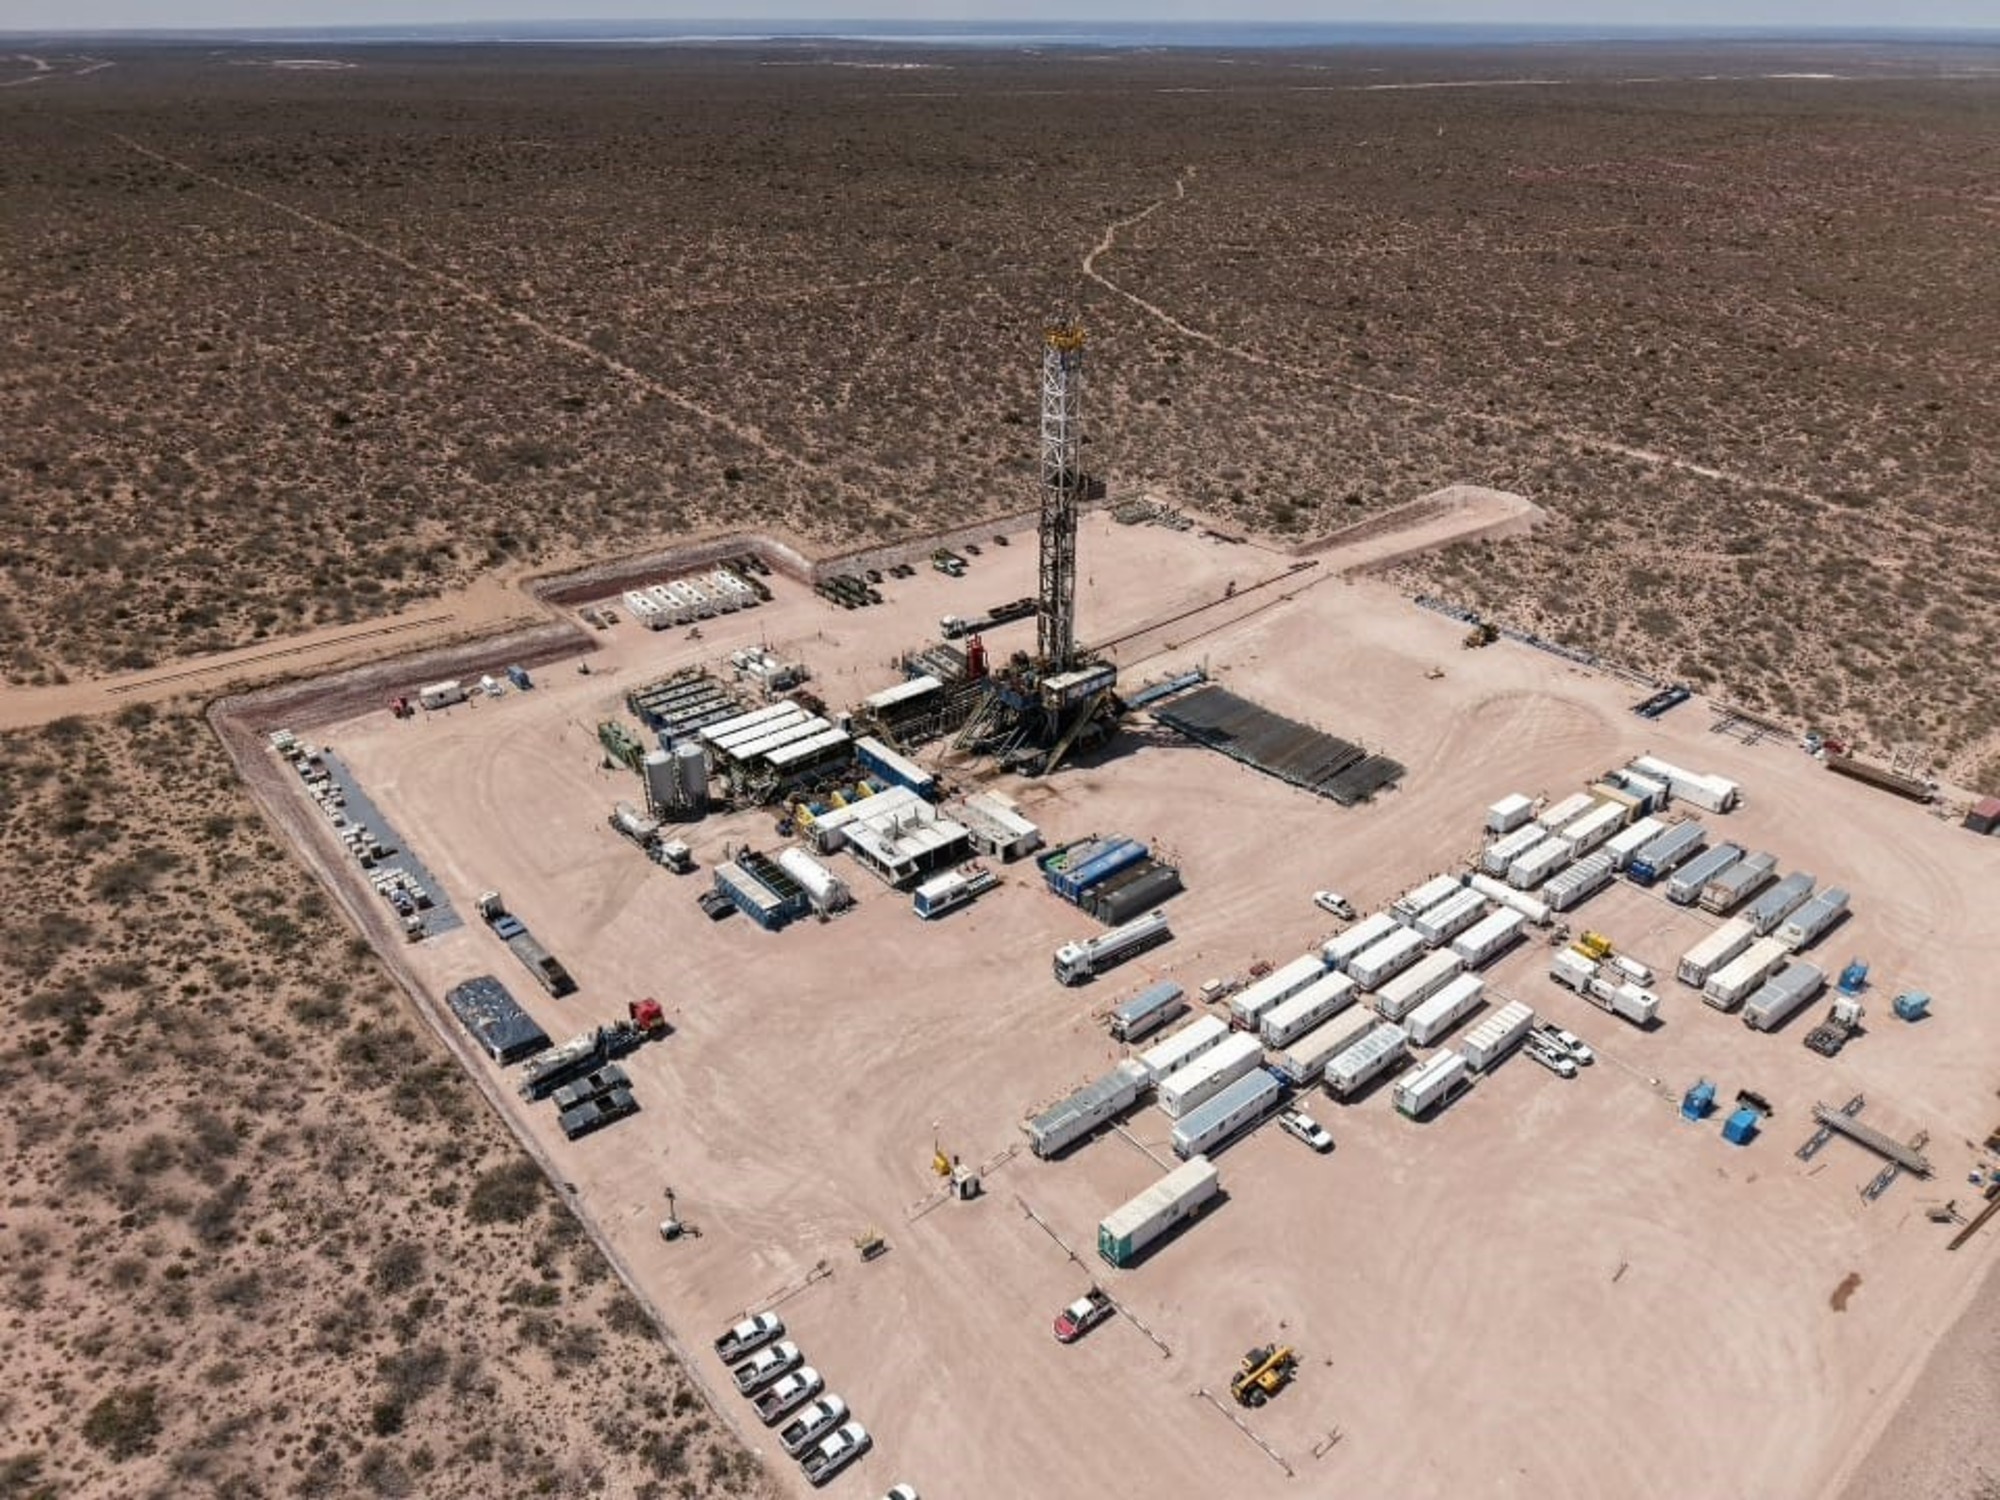
Pampa Energía announces six-month period and second quarter 2026 results
PR Newswire
BUENOS AIRES, Argentina, Aug. 4, 2026
BUENOS AIRES, Argentina, Aug. 4, 2026 /PRNewswire/ -- Pampa Energía S.A. (NYSE: PAM; Buenos Aires Stock Exchange: PAMP), an independent energy company with active participation in Argentine oil, gas and electricity, announces the results for the semester and quarter ended on June 30, 2026.
Pampa reports its financial information in US$, its functional currency. For local currency equivalents, transactional exchange rate ('FX') is applied. However, Transener and Transportadora de Gas del Sur's ('TGS') figures are adjusted for inflation as of June 30, 2026, and converted to US$ using the period-end FX. Previously reported figures remained unchanged.Second quarter 2026 ('Q2 26') main results1Sales reached US$746 million in Q2 262, up 53% year-on-year, driven by the Wholesale Electricity Market's ('WEM') new deregulation framework, which supported higher spot energy prices and B2B PPA ('Business to Business') ('Power Purchase Agreements') sales, in addition to higher crude oil output and increased gas sales to power generation, and stronger Reformer prices. Lower Plan Gas and petrochemical volumes offset these effectsThe Q2 26 reflected the continued ramp-up at Rincón de Aranda, alongside strong power generation performance, boosted by higher seasonal spot prices and the vertical integration with gas upstream.Pampa's main operational KPIsQ2 26Q2 25VariationOil and gasProduction (kboe/day)107.584.1+28 %Gas production (kboepd)84.176.1+10 %Crude oil production (kbpd)23.48.0+194 %Average gas price (US$/MBTU)4.64.0+15 %Average oil price (US$/bbl)*58.861.6-4 %PowerGeneration (GWh)5,3634,704+14 %Gross margin (US$/MWh)33.625.8+30 %PetrochemicalsVolume sold (k ton)95125-24 %Average price (US$/ton)1,459978+49 %Note: * Price net of export duty and quality/logistic discounts.Adjusted EBITDA3 totaled US$415 million, a 75% year-on-year increase, explained by higher contribution from RDA ('Rincón de Aranda'), greater power and gas vertical integration and increased spot and B2B margins in power generation, partially offset by lower realized crude oil prices due to hedging.Net income attributable to shareholders was US$172 million, 4.3x Q2 25, driven by stronger operating margins and lower income tax, partially offset by lower gains from financial instruments.Net debt stood at US$1.3 billion as of June 2026, vs. US$801 million as of December 2025, reflecting higher capital expenditures on RDA and increased collateral requirements due to oil hedging. Consolidated balance sheet(As of June 30, 2026 and December 31, 2025, in US$ million) In US$ millionAs of 06.30.2026As of 12.31.2025ASSETSProperty, plant and equipment3,4793,303Intangible assets8789Right-of-use assets2436Deferred tax asset18243Investments in associates and joint ventures1,3541,059Financial assets at fair value through profit and loss3333Trade and other receivables7843Total non-current assets5,2374,606Inventories283231Financial assets at fair value through profit and loss302366Derivatives-52Trade and other receivables948614Cash and cash equivalents979725Total current assets2,5121,988Total assets7,7496,594EQUITYShare capital3536Share capital adjustment189191Share premium517516Treasury shares adjustment11Treasury shares cost(6)(54)Legal reserve4444Voluntary reserve2,7072,399Other reserves(13)(12)Other comprehensive income97124Retained earnings 456351Equity attributable to owners of the company4,0273,596Non-controlling interest139Total equity4,0403,605LIABILITIESProvisions73100Income tax and minimum notional income tax provision2826Tax liabilities202212Deferred tax liability4656Defined benefit plans2926Borrowings2,5751,844Trade and other payables6686Total non-current liabilities3,0192,350Provisions1313Income tax liability12483Tax liabilities8356Defined benefit plans66Salaries and social security payable 2636Derivatives54-Borrowings2548Trade and other payables359397Total current liabilities690639Total liabilities3,7092,989Total liabilities and equity7,7496,594Consolidated income statement(For the six-month periods and quarters ended on June 30, 2026 and 2025, in US$ million)In US$ millionFirst halfSecond quarter2026202520262025Sales revenue1,319900746486Domestic sales1,006750555398Foreign market sales31315019188Cost of sales(862)(625)(482)(340)Gross profit457275264146Selling expenses(56)(43)(30)(22)Administrative expenses(91)(84)(47)(41)Other operating income28531921Other operating expenses(37)(40)(18)(18)Recovery of impairment/(Impairment) of financial assets2(2)3(2)Impairment of intangible assets and inventories(2)(1)(1)(1)Results for part. in joint businesses & associates148768130Operating income449234271113Financial income73532Financial costs(87)(99)(48)(58)Other financial results221221585Financial results, net(58)58(30)29Profit before tax391292241142Income tax(1)(99)(67)(103)Net income for the period39019317439Attributable to the owners of the Company38619317240Attributable to the non-controlling interest4-2(1)Net income per share to shareholders0.30.10.10.0Net income per ADR to shareholders7.13.53.20.7Average outstanding common shares11,3511,3601,3401,360Outstanding shares by the end of period11,3401,3601,3401,360Note: 1 Includes shares allocated to the employee compensation plan as treasury shares, which amounted to 3.9 million and 3.5 million shares as of June 30, 2025, and 2026, respectively. Treasury shares are deducted from shares outstanding only if they are held as common shares.Consolidated cash flow statement(For the six-month periods and quarters ended on June 30, 2026 and 2025, in millions)In US$ millionFirst halfSecond quarter2026202520262025OPERATING ACTIVITIESProfit of the period39019317439Adjustments to reconcile net profit to cash flows from operating activities195163161160Changes in operating assets and liabilities(604)(209)(121)(142)Increase (decrease) in trade receivables and other receivables(444)(254)28(142)Increase (decrease) in inventories(53)(20)(45)3Increase (decrease) in trade and other payables1765(7)(14)(Decrease) increase in salaries and social security payables(10)(10)43Defined benefit plans payments(2)(1)(1)-Increase in tax liabilities3813458Decrease in provisions(3)(4)(2)(2)Income tax payment(50)-(50)-(Payments) Collection for derivative financial instruments, net(97)2(93)2Net cash (used in) generated by operating activities(19)14721457INVESTING ACTIVITIESPayment for property, plant and equipment acquisitions(518)(444)(253)(282)Collection for sales of public securities and shares, net205316118165Subscription of mutual funds, net(9)(4)-(4)Capital integration in companies(30)(41)(14)(10)Right-of-use---1Collection for intangible assets sales-3-3Dividends collection1-1-Collection for interests in areas sales5252Net cash used in investing activities(346)(168)(143)(125)FINANCING ACTIVITIESProceeds from borrowings732380732335Payment of borrowings(32)(108)(9)(38)Payment of borrowings interests(68)(101)(46)(63)Repurchase and redemption of corporate bonds(2)(725)-(365)Payment of leases(11)(2)(5)(1)Net cash generated by (used in) financing activities619(556)672(132)Increase (decrease) in cash and cash equivalents254(577)743(200)Cash and cash equivalents at the beginning of the period725738236361Increase (Decrease) in cash and cash equivalents254(577)743(200)Cash and cash equivalents at the end of the period979161979161For the full version of the Earnings Report, please visit Pampa's Investor Relations website: ri.pampa.com/en.Information about the videoconferenceThere will be a videoconference to discuss Pampa's Q2 26 results on Wednesday, August 5, 2026, at 10:00 a.m. Eastern Standard Time/11:00 a.m. Buenos Aires Time. The hosts will be Gustavo Mariani, CEO, Adolfo Zuberbühler, CFO and Lida Wang, IR & ESG Officer at Pampa.For those interested in participating, please register here.For further information about Pampa:1 The information is based on financial statements ('FS') prepared according to International Financial Reporting Standards ('IFRS') in force in Argentina. 2 Sales from the affiliates CTBSA, Transener and TGS are excluded, shown as 'Results for participation in joint businesses and associates.'3 Consolidated adjusted EBITDA represents the flows before financial items, income tax, depreciations and amortizations, extraordinary and non-cash income and expense, equity income, and includes affiliates' EBITDA at our ownership.