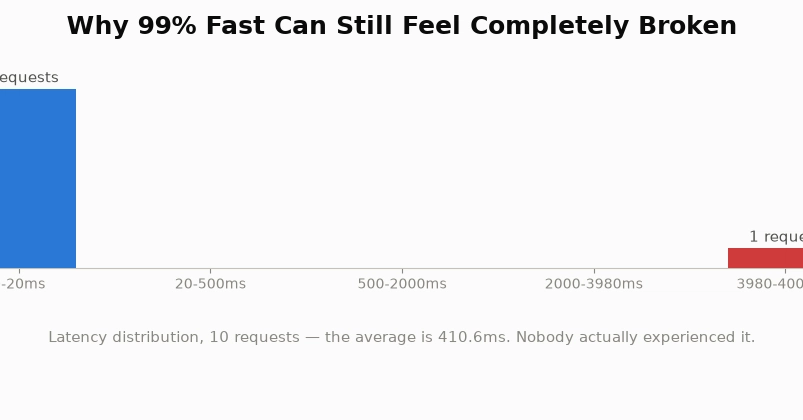
Your nginx $request_time looks fine in the dashboard — p95 is 120ms, totally reasonable.
But users keep reporting that things "occasionally freeze." You dig through the logs looking for slow requests and find nothing obvious. Overall p95 is healthy. The upstream app team says "our side is fast." nginx looks fast too. Yet the complaints are real. You don't know where to look.
$request_time collapses everything that happened during the request into a single number. Fast phases and slow phases all get averaged together, making it impossible to see where the time actually went.
nginx does record timestamps at each intermediate checkpoint, though. Subtract them, and latency breaks into 4 distinct parts.
The log variables covered here and what they measure are the same regardless of nginx version.