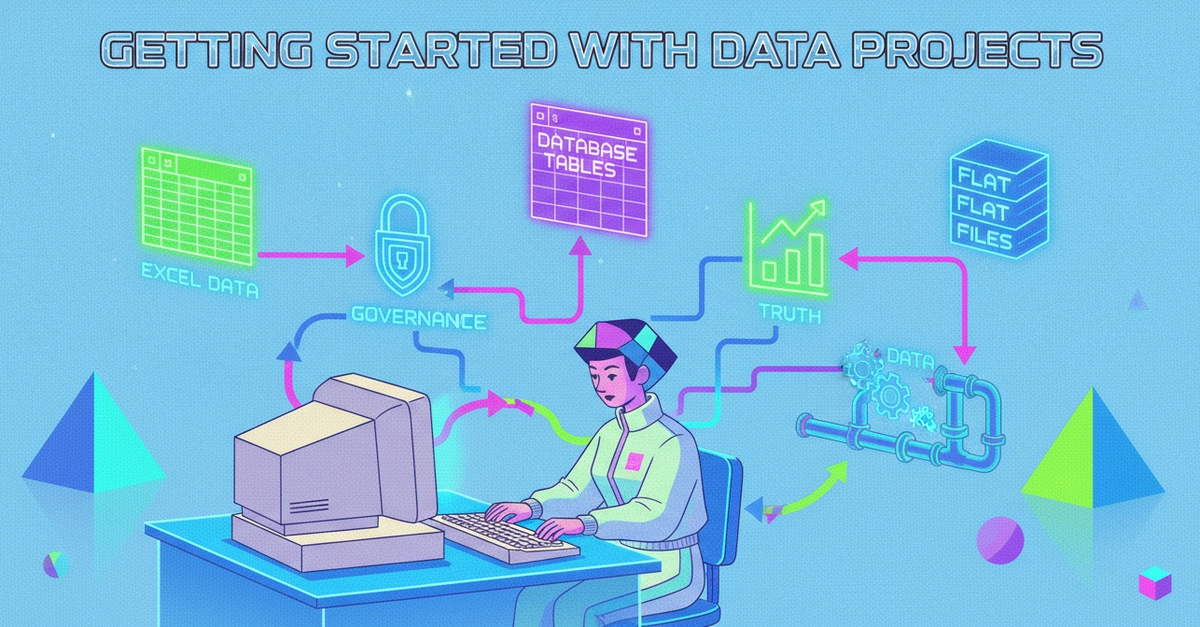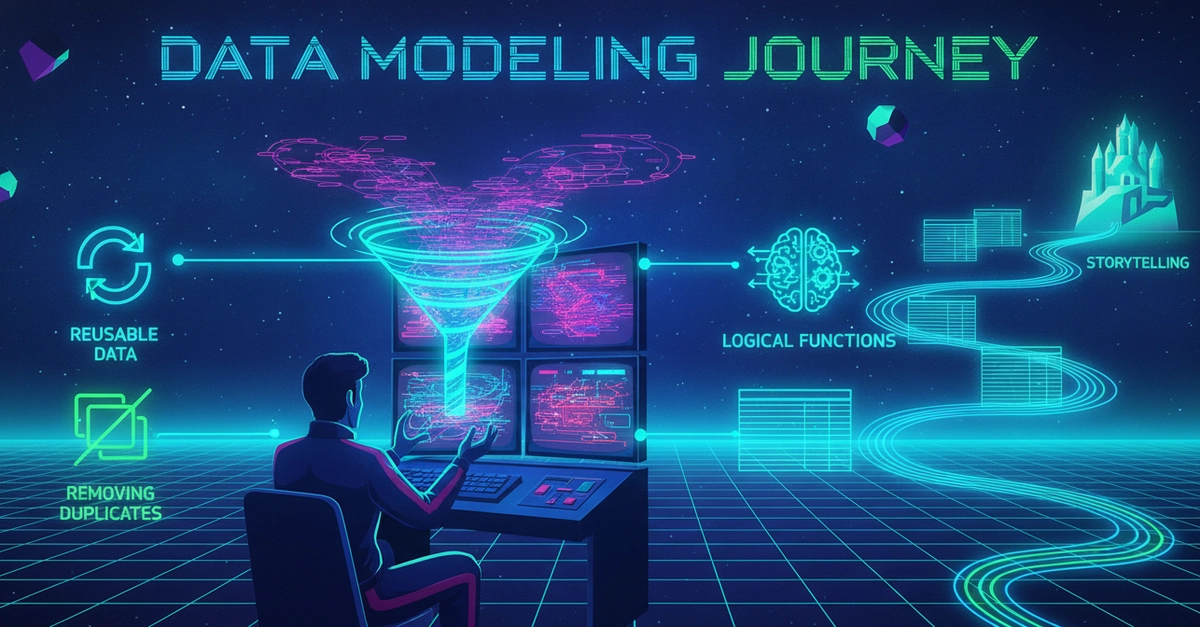
When I started learning about data analysis, I thought it was all about numbers and charts. But the deeper I go, the more I realize it’s about how you shape and prepare data to tell a story. Recently, I’ve been exploring data modeling and common analyst techniques, and I want to share what that journey has felt like
One of the first lessons was about making data reusable. At first, I didn’t understand why this mattered, why not just work with data once and move on? But then I realized: reusable data saves time, reduces errors, and makes collaboration easier. It’s like cooking a big meal and storing portions for later instead of starting from scratch every time.
Next, I learned how to model data using queries. This was eye opening. Queries aren’t just commands; they’re like conversations with your data. You ask questions, and the data responds. I remember the first time I wrote a query that combined multiple tables, it felt like unlocking a hidden dialogue.
Then came Power Query, and honestly, it felt like magic. Instead of writing everything manually, I could visually shape and transform data. It was like sculpting clay, pulling, merging, and reshaping until the dataset told the story I needed.