Streamlit makes it remarkably fast to transform raw Python scripts into interactive, web-based data applications without needing any frontend knowledge in HTML, CSS, or JavaScript.
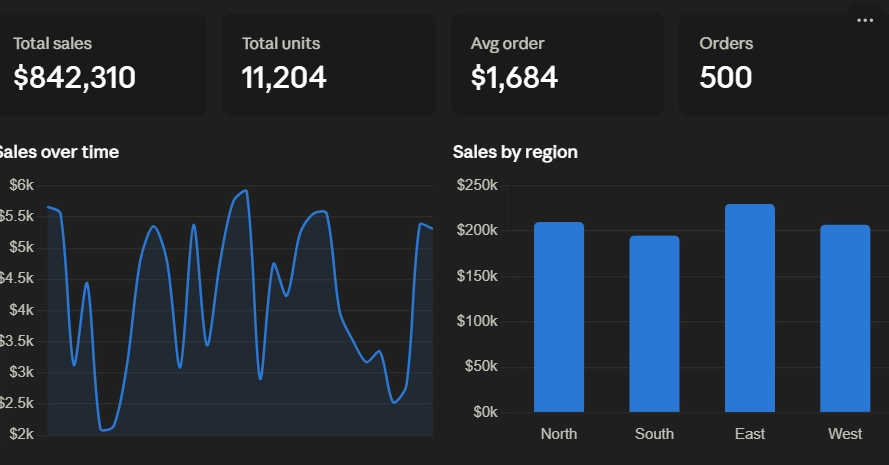
In this tutorial, we will build a full-featured **Sales Analytics Dashboard** complete with real-time sidebar filtering, custom KPI metric cards, dynamic line/bar charts, and expandable data preview tables.
## Prerequisites
To follow along, make sure you have Python 3.9+ installed along with the required libraries:
Enter fullscreen mode