Ardagh Metal Packaging S.A. - Second Quarter 2026 Results
PR Newswire
LUXEMBOURG, July 23, 2026
LUXEMBOURG, July 23, 2026 /PRNewswire/ -- Ardagh Metal Packaging S.A. (NYSE: AMBP) today announced results for the second quarter ended June 30, 2026.
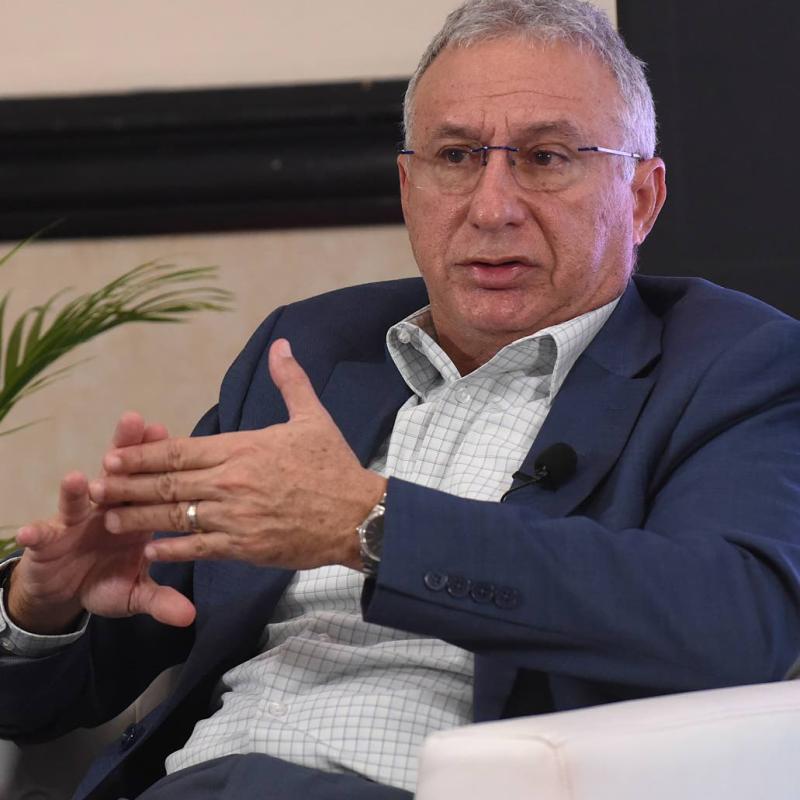
Three months endedJune 30, 2026June 30, 2025ChangeConstant Currency($'m except per share data)Revenue1,7131,45518 %16 %Profit for the period355Adjusted EBITDA (1)24021014 %13 %Earnings per share0.06—Adjusted earnings per share (1)0.110.08Dividend per ordinary share0.100.10Oliver Graham, CEO of Ardagh Metal Packaging (AMP), said:"AMP continued its strong performance in the second quarter, with Adjusted EBITDA growth of 14% versus the prior year, significantly ahead of our guidance. Beverage can shipments declined by 1% versus the prior year quarter as we cycled strong prior year growth. Shipments were also impacted by contract resets in North America and lower shipments in Brazil following outperformance in the first quarter, partly offset by strong volume growth in Europe. This was in line with our expectations and comes ahead of an expected return to modest global volume growth in the second half, supported by the strength in global beverage can demand and our attractive customer and portfolio mix.Our Adjusted EBITDA outperformance in the quarter was primarily driven by Europe, which benefitted from favorable input cost recovery and strong volume growth. Americas performance was broadly in line with expectations – despite softness in the Brazil industry, and metal supply constraints impacting shipments in North America. Metal supply availability in North America significantly improved over the course of the second quarter, and we anticipate operating under normal supply conditions during the second half of the year. We are pleased to upgrade our full–year 2026 Adjusted EBITDA guidance, despite an uncertain macro–economic backdrop, to a range of between $775–790 million.I would like to share that this year AMP celebrates it's 10–year anniversary since its formation. Over the last decade, AMP has developed into a resilient global competitor, backed by significant investment in our facilities, our people and in our processes, to support the growth of our global and regional customers across a diverse range of categories. In celebrating this milestone, we extend our thanks to our customers, employees, suppliers and to all stakeholders that have made this successful journey possible, and we look forward to continued success ahead."Global beverage can shipments declined by 1% in the quarter versus the prior year quarter, and cycled strong prior year growth (+5%). The global shipments decline was driven by a decrease of 6% in the Americas as North America decreased by 5%, as a result of the previously communicated contract resets, and Brazil decreased by 15% due to customer mix. H1 Brazil shipments were broadly in line with the industry. This was offset by growth of 5% in Europe.Adjusted EBITDA of $240 million for the quarter was ahead of our guidance range of $210–220 million, driven by a strong outperformance in Europe and represented a 14% increase (13% at constant currency) versus the prior year quarter.In the Americas Adjusted EBITDA for the quarter increased by 2% to $135 million, resulting from lower operations and overhead costs compared with the prior year quarter, partly offset by lower input cost recovery and lower shipments.In Europe Adjusted EBITDA for the quarter increased by 36% (33% at constant currency) to $105 million, primarily due to stronger input cost recovery – including a favorable pricing impact related to metal timing – and volume growth, partly offset by higher operations and overhead costs.Strong total liquidity position of $647 million at June 30, 2026. Net debt to Adjusted EBITDA ratio reduces to 5.2x – favourable to expectations – and down from 5.3x at June 30, 2025 (5.7x on a like for like basis, pro–forma for the Q4 2025 refinancing of the preferred shares).Regular quarterly ordinary dividend of 10c announced. No change to capital allocation priorities.2026 Adjusted EBITDA guidance improved: Raising the full year 2026 Adjusted EBITDA guidance range to between $775–790 million, from the prior guidance range of $750–775 million, assuming modest global shipments growth. Guidance assumes some reversal of the favorable first half timing–related factors during the second half – such as the favorable pricing impact of metal timing and Q1 revaluation gains related to freight cost hedging – as well as some inflationary headwinds as a result of the conflict in the Middle East.Third quarter Adjusted EBITDA expected to be in the range of $200–210 million. This compares with Q3 2025 Adjusted EBITDA of $208 million ($207 million at constant currency).Financial Performance ReviewBridge of 2025 to 2026 Revenue and Adjusted EBITDAThree months ended June 30, 2026RevenueEuropeAmericasGroup$'m$'m$'mRevenue 20256158401,455Organic63175238FX translation20—20Revenue 20266981,0151,713Adjusted EBITDAEuropeAmericasGroup$'m$'m$'mAdjusted EBITDA 202577133210Organic 26228FX translation2—2Adjusted EBITDA 20261051352402026 Adjusted EBITDA margin %15.0 %13.3 %14.0 %2025 Adjusted EBITDA margin %12.5 %15.8 %14.4 %Six months ended June 30, 2026RevenueEuropeAmericasGroup$'m$'m$'mRevenue 20251,1431,5802,723Organic95314409FX translation85—85Revenue 20261,3231,8943,217Adjusted EBITDAEuropeAmericasGroup$'m$'m$'mAdjusted EBITDA 2025126239365Organic 46—46FX translation8—8Adjusted EBITDA 20261802394192026 Adjusted EBITDA margin %13.6 %12.6 %13.0 %2025 Adjusted EBITDA margin %11.0 %15.1 %13.4 %Group PerformanceGroupRevenue increased by $258 million or 18% to $1,713 million in the three months ended June 30, 2026, compared with $1,455 million in the same period last year. On a constant currency basis, revenue increased by 16%, principally reflecting the pass through of higher input costs to customers and favorable volume/mix effects.Adjusted EBITDA increased by $30 million, or 14%, to $240 million in the three months ended June 30, 2026, compared with $210 million in the same period last year. On a constant currency basis, Adjusted EBITDA increased by 13%, principally due to higher input cost recovery, partly offset by higher operations and overhead costs.AmericasRevenue increased by $175 million, or 21%, on a reported and constant currency basis, to $1,015 million in the three months ended June 30, 2026, compared with $840 million in the same period last year, principally reflecting the pass through of higher input costs to customers, partly offset by unfavorable volume/mix effects.Adjusted EBITDA increased by $2 million, or 2%, to $135 million on a reported and constant currency basis, compared with $133 million in the same period last year, primarily driven by lower operations and overhead costs, partly offset by lower input cost recovery and unfavorable volume/mix effects.EuropeRevenue increased by $83 million, or 13%, to $698 million in the three months ended June 30, 2026, compared with $615 million in the same period last year. On a constant currency basis, revenue increased by 10% principally due to the pass through of higher input costs to customers and favorable volume/mix effects.Adjusted EBITDA increased by $28 million, or 36%, to $105 million in the three months ended June 30, 2026, compared with $77 million in the same period last year. On a constant currency basis, Adjusted EBITDA increased by 33% principally due to higher input cost recovery, partly offset by higher operations and overhead costs.Earnings Webcast and Conference Call DetailsArdagh Metal Packaging S.A. (NYSE: AMBP) will hold its second quarter 2026 earnings webcast and conference call for investors at 9.00 a.m. EDT (2.00 p.m. BST) on Thursday July 23, 2026. Please use the following webcast link to register for this call:Webcast registration and access:https://event.webcasts.com/viewer/event.jsp?ei=1765961&tp_key=0376c05a25Conference call dial in:United States/Canada: +1 646 769 9200International: +44 020 7769 6464Participant pin code: 4417361An investor earnings presentation to accompany this release is available at https://ir.ardaghmetalpackaging.com/About Ardagh Metal PackagingArdagh Metal Packaging (AMP) is a leading global supplier of sustainable and infinitely recyclable metal beverage cans to brand owners globally. An operating business of sustainable packaging business Ardagh Group, AMP is a leading industry player across Europe and the Americas with innovative production capabilities. AMP operates 23 production facilities in nine countries, employing approximately 6,500 people with sales of approximately $5.5 billion in 2025.For more information, visit https://ir.ardaghmetalpackaging.com/Forward-Looking StatementsThis release contains "forward-looking statements" within the meaning of Section 27A of the U.S. Securities Act of 1933, as amended and Section 21E of the U.S. Securities Exchange Act of 1934, as amended. Forward-looking statements are not historical facts and are inherently subject to known and unknown risks and uncertainties, many of which may be beyond our control. We caution you that the forward-looking information presented in this press release is not a guarantee of future events, and that actual events may differ materially from those made in or suggested by the forward-looking information contained in this release. Certain factors that could cause actual events to differ materially from those discussed in any forward-looking statements include the risk factors described in Ardagh Metal Packaging S.A.'s Annual Report on Form 20-F for the year ended December 31, 2025 filed with the U.S. Securities and Exchange Commission (the "SEC") and any other public filings made by Ardagh Metal Packaging S.A. with the SEC. In addition, new risk factors and uncertainties emerge from time to time, and it is not possible for us to predict all risk factors and uncertainties, nor can we assess the impact of all factors on our business or the extent to which any factor, or combination of factors, may cause actual events to differ materially from those contained in any forward-looking statements. Under no circumstances should the inclusion of such forward-looking statements in this release be regarded as a representation or warranty by us or any other person with respect to the achievement of results set out in such statements or that the underlying assumptions used will in fact be the case. Therefore, you are cautioned not to place undue reliance on these forward-looking statements. Any forward-looking information presented herein is made only as of the date of this release, and we do not undertake any obligation to update or revise any forward-looking information to reflect changes in assumptions, the occurrence of unanticipated events, or otherwise. This announcement contains inside information for the purposes of Article 7 of Regulation (EU) No 596/2014. The person responsible for the release of this information on behalf of Ardagh Metal Packaging Finance plc and Ardagh Metal Packaging Finance USA LLC is Stephen Lyons, Investor Relations Director.Non-IFRS Financial MeasuresThis release may contain certain financial measures such as Adjusted EBITDA, Adjusted operating cash flow, Adjusted free cash flow, net debt and ratios relating thereto that are not calculated in accordance with IFRS® Accounting Standards. Non-IFRS financial measures may be considered in addition to IFRS financial information, but should not be used as substitutes for the corresponding IFRS measures. The non-IFRS financial measures used by Ardagh Metal Packaging S.A. may differ from, and not be comparable to, similarly titled measures used by other companies.Contacts:Investors: Email: stephen.lyons@ardaghgroup.comUnaudited Consolidated Condensed Income Statement for the three months ended June 30, 2026 and 2025Three months ended June 30, 2026Three months ended June 30, 2025Before exceptionalitemsExceptional itemsTotalBefore exceptional itemsExceptional itemsTotal$'m$'m$'m$'m$'m$'mRevenue1,713—1,7131,455—1,455Cost of sales(1,474)(1)(1,475)(1,257)(13)(1,270)Gross profit239(1)238198(13)185Sales, general and administration expenses(84)(3)(87)(67)(1)(68)Intangible amortization(36)—(36)(35)—(35)Operating profit119(4)11596(14)82Net finance expense(62)(2)(64)(59)(8)(67)Profit before tax57(6)5137(22)15Income tax (charge)/credit(17)1(16)(11)1(10)Profit for the period40(5)3526(21)5Earnings per share:Basic and diluted earnings per share attributable to equity holders0.06—Unaudited Consolidated Condensed Income Statement for the six months ended June 30, 2026 and 2025Six months ended June 30, 2026Six months ended June 30, 2025Before exceptional itemsExceptional itemsTotalBefore exceptional itemsExceptional itemsTotal$'m$'m$'m$'m$'m$'mRevenue3,217—3,2172,723—2,723Cost of sales(2,799)(2)(2,801)(2,373)(15)(2,388)Gross profit418(2)416350(15)335Sales, general and administration expenses(167)(6)(173)(142)(2)(144)Intangible amortization(72)—(72)(68)—(68)Operating profit179(8)171140(17)123Net finance expense(119)(5)(124)(115)(2)(117)Profit before tax60(13)4725(19)6Income tax (charge)/credit(18)1(17)(7)1(6)Profit for the period42(12)3018(18)—Earnings/(loss) per share:Basic and diluted earnings/(loss) per share attributable to equity holders0.05(0.02)Unaudited Consolidated Condensed Statement of Financial PositionAt June 30, 2026At December 31, 2025$'m$'mNon-current assetsIntangible assets1,0981,181Property, plant and equipment2,4292,515Other non-current assets1431433,6703,839Current assetsInventories584509Trade and other receivables756467Contract assets280267Income tax receivable3234Derivative financial instruments5841Cash, cash equivalents and restricted cash 1895221,8991,840TOTAL ASSETS5,5695,679TOTAL EQUITY(750)(675)Non-current liabilitiesBorrowings including lease obligations4,2134,301Other non-current liabilities3113244,5244,625Current liabilitiesBorrowings including lease obligations131118Payables and other current liabilities*1,6641,6111,7951,729TOTAL LIABILITIES6,3196,354TOTAL EQUITY and LIABILITIES5,5695,679*Payables and other current liabilities include liabilities for earnout shares of $8 million at June 30, 2026 (December 2025: $3 million, included in other non-current liabilities).Unaudited Consolidated Condensed Statement of Cash FlowsThree months ended June 30,Six months ended June 30,2026202520262025$'m$'m$'m$'mCash flows from/(used in) operating activitiesCash generated from operations (2)4023197743Net interest paid(99)(82)(110)(99)Settlement of foreign currency derivative financial instruments(1)(24)(8)(31)Income tax paid(10)(3)(13)(13)Cash flows from/(used in) operating activities292210(54)(100)Cash flows used in investing activitiesPurchase of property, plant and equipment and intangible assets(36)(42)(95)(81)Net cash used in investing activities(36)(42)(95)(81)Cash flows used in financing activitiesChanges in borrowings(115)(4)23(6)Deferred debt issue costs paid(4)(2)(12)(3)Lease payments(29)(26)(74)(51)Dividends paid(60)(66)(120)(132)Net cash used in financing activities(208)(98)(183)(192)Net increase/(decrease) in cash, cash equivalents and restricted cash4870(332)(373)Cash, cash equivalents and restricted cash at beginning of period142177522610Foreign exchange (losses)/gains on cash, cash equivalents and restricted cash(1)9(1)19Cash, cash equivalents and restricted cash at end of period189256189256Financial assets and liabilitiesAt June 30, 2026, the Group's net debt and available liquidity was as follows:Drawn amountAvailable liquidity$'m$'mSenior Secured Green and Senior Green Notes 4,002—Global Asset Based Loan facility28361Bradesco facility—97Lease obligations325—Other borrowings18—Total borrowings / undrawn facilities 4,373458Deferred debt issue costs (29)—Net borrowings / undrawn facilities 4,344458Cash, cash equivalents and restricted cash(189)189Derivative financial instruments used to hedge foreign currency and interest rate risk——Net debt / available liquidity 4,155647Reconciliation of profit for the period to Adjusted profit for the periodThree months ended June 30,20262025$'m$'mProfit for the period as presented in the income statement355Less: Dividend on preferred shares —(6)Profit/(loss) for the period used in calculating earnings per share35(1)Exceptional items, net of tax521Intangible amortization, net of tax2828Adjusted profit for the period6848Weighted average number of ordinary shares597.7597.7Earnings per share0.06—Adjusted earnings per share0.110.08Reconciliation of profit for the period to Adjusted EBITDAThree months ended June 30,Six months ended June 30,2026202520262025$'m$'m$'m$'mProfit for the period 35530—Income tax charge1610176Net finance expense6467124117Depreciation and amortization121114240225Exceptional operating items414817Adjusted EBITDA240210419365Reconciliation of Adjusted EBITDA to Adjusted operating cash flow and Adjusted free cash flowThree months ended June 30,Six months ended June 30,2026202520262025$'m$'m$'m$'mAdjusted EBITDA240210419365Movement in working capital166113(332)(315)Maintenance capital expenditure(29)(27)(66)(51)Lease payments(29)(26)(74)(51)Exceptional restructuring costs paid——(1)(1)Adjusted operating cash flow348270(54)(53)Net interest paid(99)(82)(110)(99)Settlement of foreign currency derivative financial instruments(1)(24)(8)(31)Income tax paid(10)(3)(13)(13)Adjusted free cash flow - pre Growth Investment capital expenditure238161(185)(196)Growth investment capital expenditure(7)(15)(29)(30)Adjusted free cash flow - post Growth Investment capital expenditure231146(214)(226)Related Footnotes (1) For a reconciliation to the most comparable IFRS measures, see Page 10.(2) Cash from operations for the three months ended June 30, 2026 is derived from the aggregate of Adjusted EBITDA as presented on Page 10, working capital inflows of $166 million (2025: inflows of $113 million) and other exceptional cash outflows of $4 million (2025: outflows of $4 million). Cash used in operations for the six months ended June 30, 2026 is derived from the aggregate of Adjusted EBITDA as presented on Page 10, working capital outflows of $332 million (2025: outflows of $315 million) and other exceptional cash outflows of $10 million (2025: outflows of $7 million).