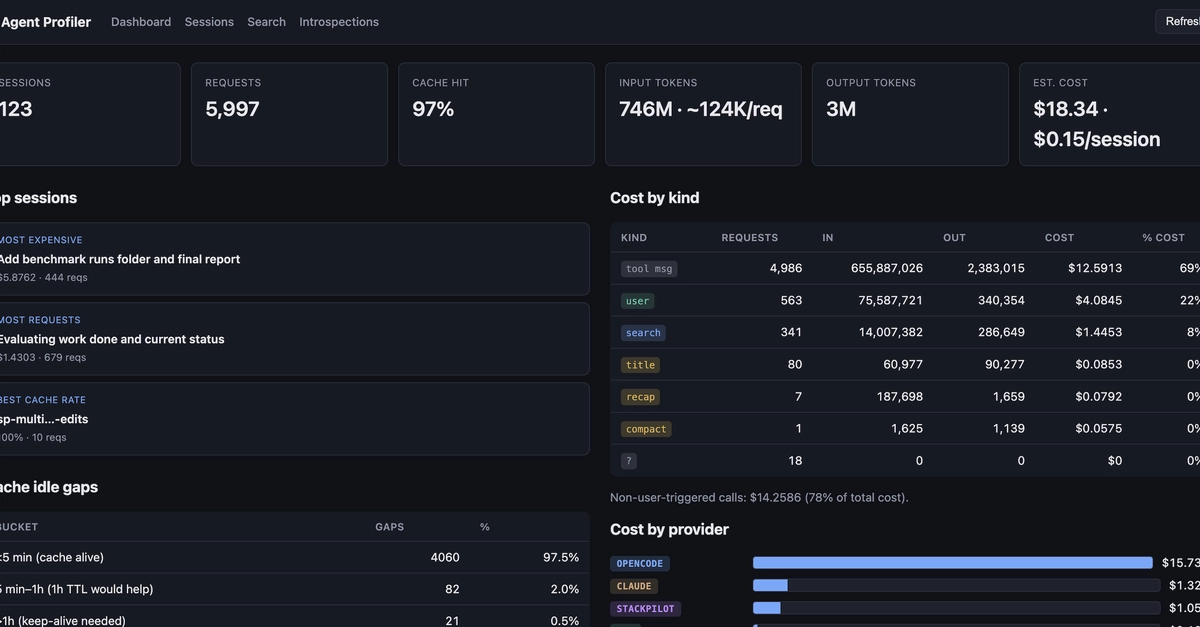
I built a local-first profiler that sits as a transparent reverse proxy between your coding agent (Claude Code, OpenCode) and the LLM provider, recording every request without adding latency. It's like perf for your agent — showing you exactly where your tokens go.
Live demo (read-only dashboard with sample data).
What it surfaced after profiling my own sessions
Only ~60% of my API cost was my actual prompts. The rest was agent overhead I never saw — subagent exploration (search), context compaction, catch-up summaries when I stepped away, and session-title generation. The profiler classifies every request into 11 kinds (main, search, compact, recap, title, subagent, webfetch, quota, tool_result, guide, unknown) and shows a "Cost by kind" table. The search subagent alone ate ~25-30% of tokens when I told the agent "explore thoroughly."
The 5-minute cache TTL penalty is real and expensive. Claude Code places cache_control: {"type": "ephemeral"} markers without an explicit TTL — so your cached prefix (system prompt, tools, message history) expires after ~5 minutes of inactivity. Step away to read docs or grab coffee, come back, and the next request pays a full cache write on potentially 200K+ tokens. On Opus models, a cache write is a massive multiplier on your first request back. The profiler detects cold regenerations, marks them with severity badges, and shows exactly what each idle gap cost you.