A four-year, 15-minute stock backtest is about 140k bars for one stock. With 50 stocks, that is already around 7 million rows before parameter sweeps. If you are preparing features for a model, it is easy to spend 10 minutes just building the data table before training even starts.
That is the part that kept bothering me. The strategy or model is supposed to be the hard part, but the research loop often gets stuck rebuilding the feature table: RSI, MACD, ATR, Bollinger Bands, and dozens more. In a live loop or a bar-by-bar backtest, every new OHLCV bar can trigger a full-column recompute even though most of the column is already valid.
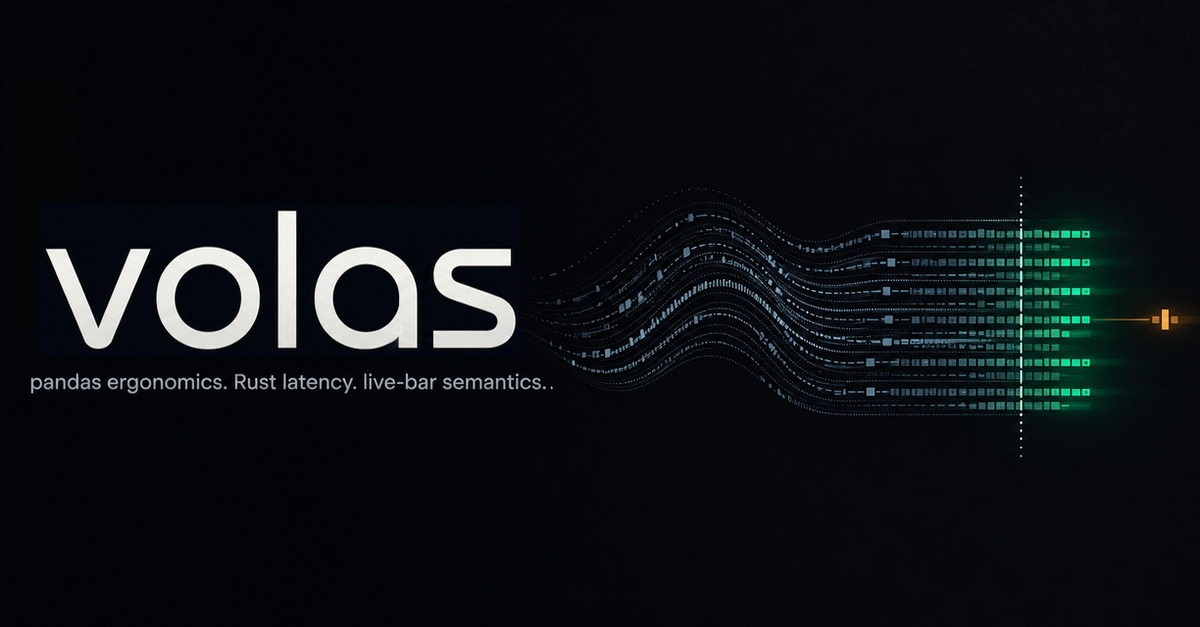
I built volas for that workflow: keep the OHLCV table familiar, but make indicator refresh cheap.
volas is a Rust-backed Python DataFrame for OHLCV/candlestick pipelines. Indicators are addressed like DataFrame columns:
df["rsi:14"]