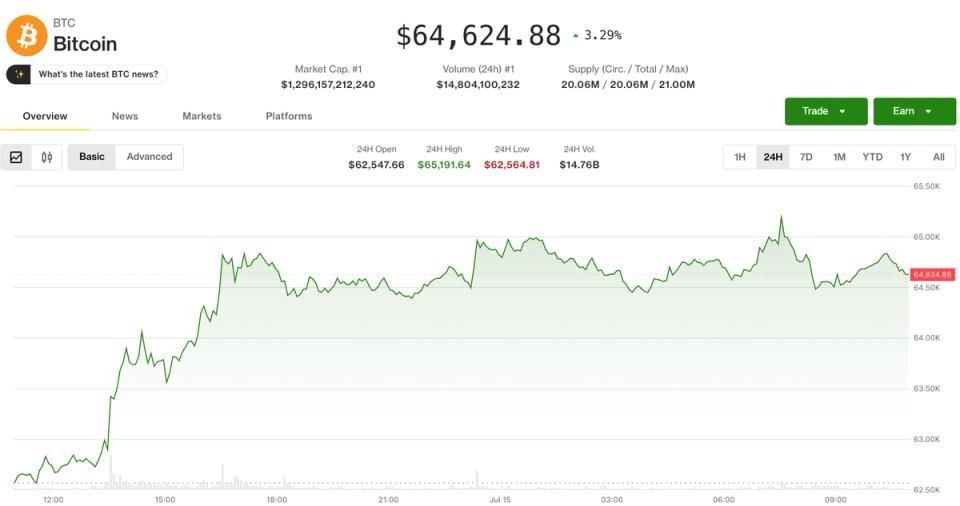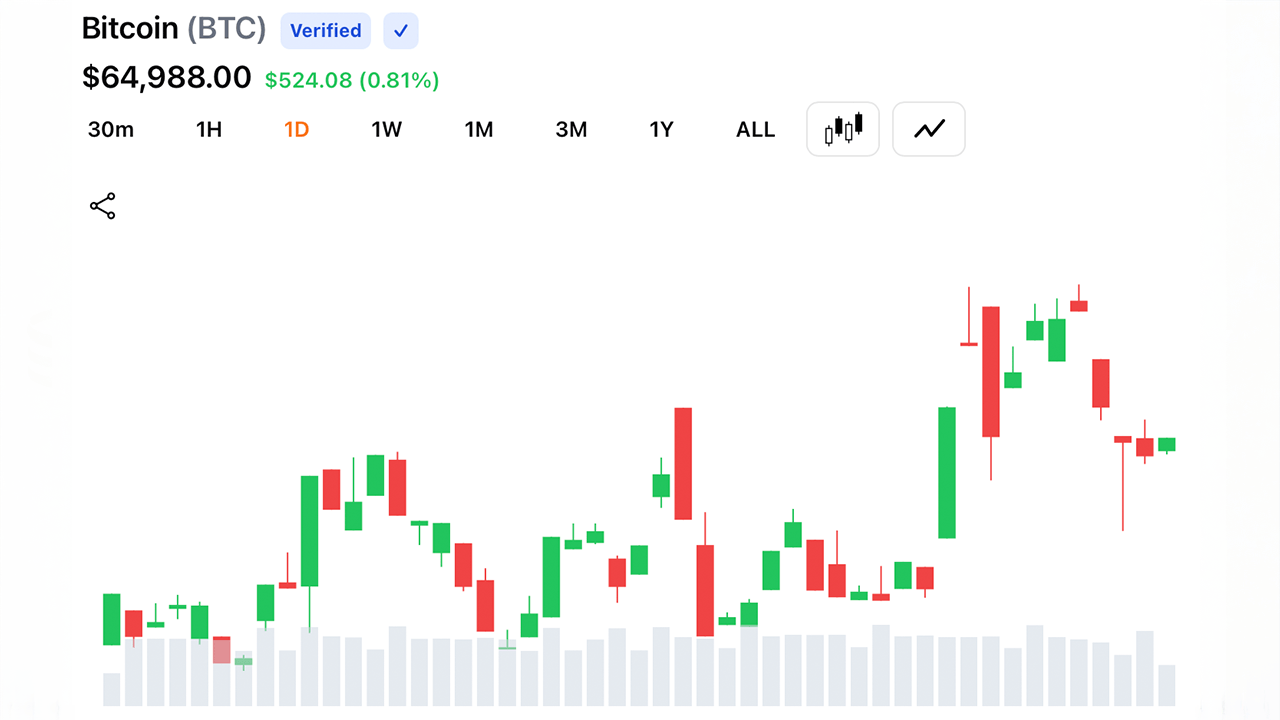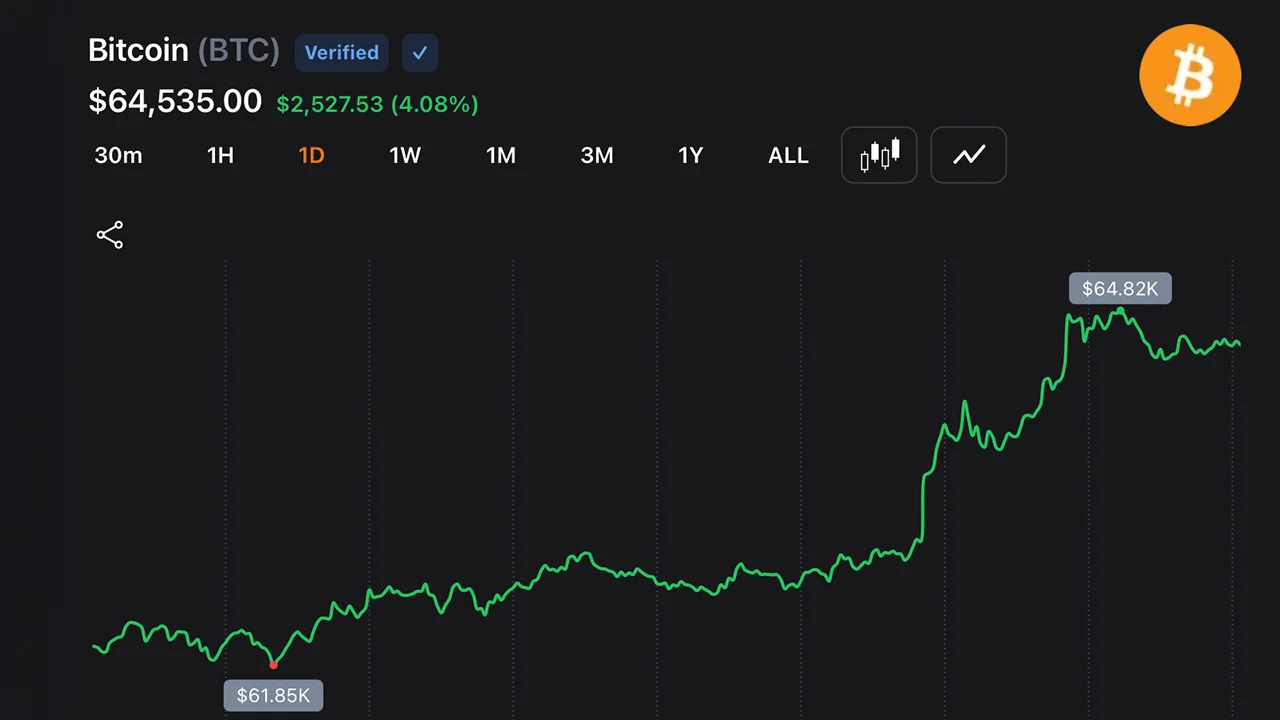
Analyst Benjamin Cowen still warns the setup mirrors a 2018 pattern that gave back all its gains by September.Is Bitcoin Replaying The 2018 Fake Rally?Cowen drew a direct parallel to 2018 on X. That year, Bitcoin started late June and early July with two green weeks, pulled back red into CPI, then bounced higher into late July before surrendering all gains by September. He said today’s setup looks similar.The chart adds weight to that concern. Bitcoin broke above the descending trendline that capped every rally since the May top and reclaimed the 20-day EMA at $62,955 on the same candle, a meaningful structural shift. RSI crossed above 50 for the first time since late May, confirming the momentum move.The question traders are sitting with is whether this is the start of a recovery or another bounce that fades into overhead supply, exactly as it did in 2018.Key levels for Bitcoin
$62,955 — 20-day EMA, now acting as support; losing this turns the breakout into a fakeout
$65,060 — 50-day EMA, first resistance above
$67,000 to $68,000 — next resistance zone if $65,060 clears