SELLAS Life Sciences shares are volatile Wednesday. Why is SLS stock down today?
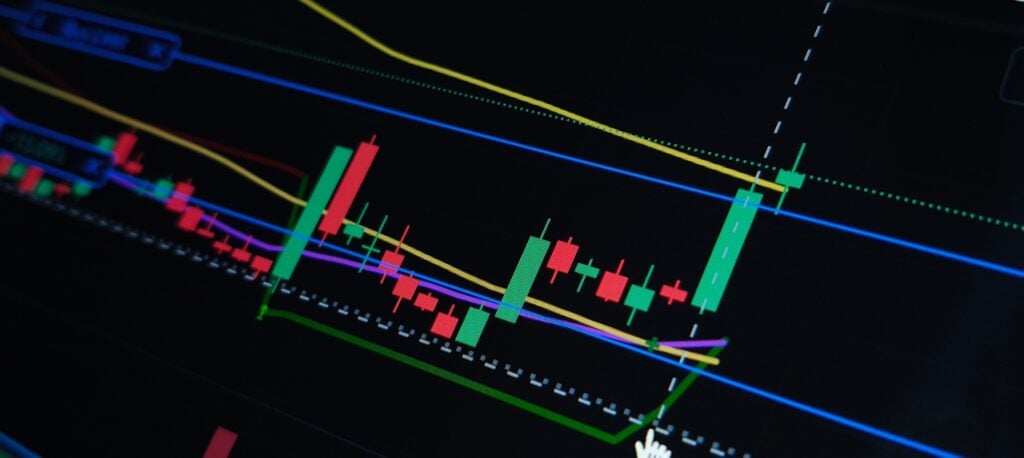
Critical Moving Averages Levels for SLS StockThe bigger picture remains bullish: SLS is trading well above its major moving averages, including about 32% above the 20-day SMA ($10.55) and more than 200% above the 200-day SMA ($4.54), which is typical of a strong trend that’s still being accumulated on dips. The 20-day SMA is above the 50-day SMA, and the 50-day SMA is above the 200-day SMA—two trend-confirming alignments that usually keep pullbacks "buyable" until they break.For momentum, MACD is the cleaner read right now: it’s above its signal line and the histogram is positive, which points to improving upside pressure versus the prior downswing. In plain terms, when MACD is above its signal line, it suggests momentum is turning back in favor of buyers rather than sellers.From a levels standpoint, the stock is pressing into prior supply near the top of its 52-week range ($15.88), so traders will watch whether it can build acceptance above recent pivot zones rather than just spike and fade.
Key Resistance: $16.00 — a round-number area just above the 52-week high zone where rebounds can stall