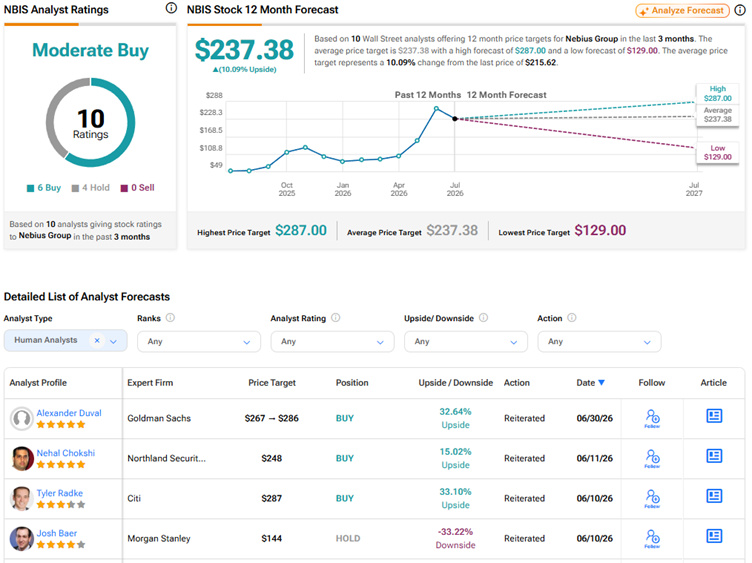
The stock closed down 8.37% in Tuesday’s regular session and extended those losses before the opening bell. Nasdaq futures were down 0.68%, while S&P 500 futures slipped 0.54%.Technical AnalysisNebius remains in a long-term uptrend despite the recent correction. The stock trades 22% below its 20-day simple moving average of $245.15 and 11.9% below its 50-day SMA of $216.99. However, it remains 14.8% above its 100-day SMA of $166.54 and 42.6% above its 200-day SMA of $134.06.The moving-average structure remains constructive because the 20-day SMA stays above the 50-day SMA, while the 50-day SMA remains above the 200-day SMA. That suggests the broader trend is still intact despite near-term weakness.Momentum has weakened, however. The MACD remains below its signal line, and the histogram is negative, indicating buying momentum has faded.The next resistance level sits near the 50-day SMA at $216.99. Key support is the 100-day SMA at $166.54, where buyers may step in if selling continues.Earnings And Analyst OutlookThe next major catalyst is the company’s estimated Aug. 6, 2026, earnings release.Wall Street expects a loss of 73 cents per share on revenue of $576.67 million, compared with a loss of 38 cents per share and revenue of $105.10 million a year earlier.The stock carries a consensus Buy rating with an average analyst price forecast of $213.89. Recent analyst actions include:
Why Is Nebius Group Stock Falling Wednesday? - Nebius Group (NASDAQ:NBIS)
NBIS stock hits near-term weakness but holds its long-term uptrend. Discover the key technical support and resistance levels for Nebius.
252 words~1 min read