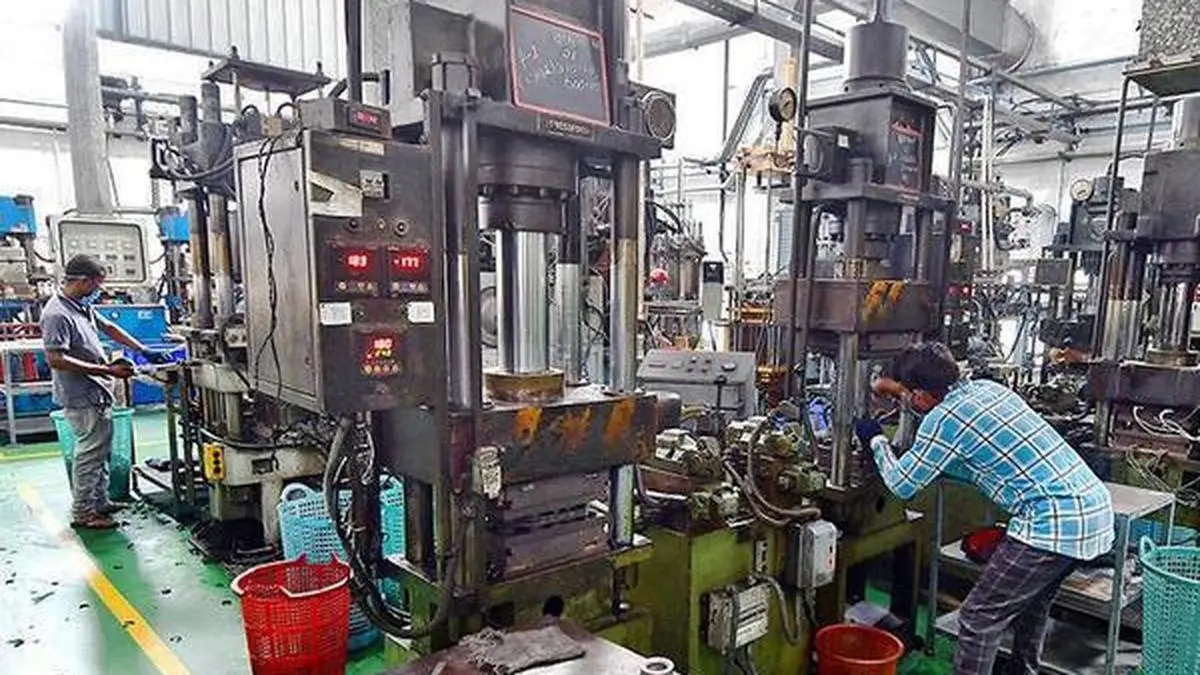
Industry: Patchy growth
| Photo Credit:
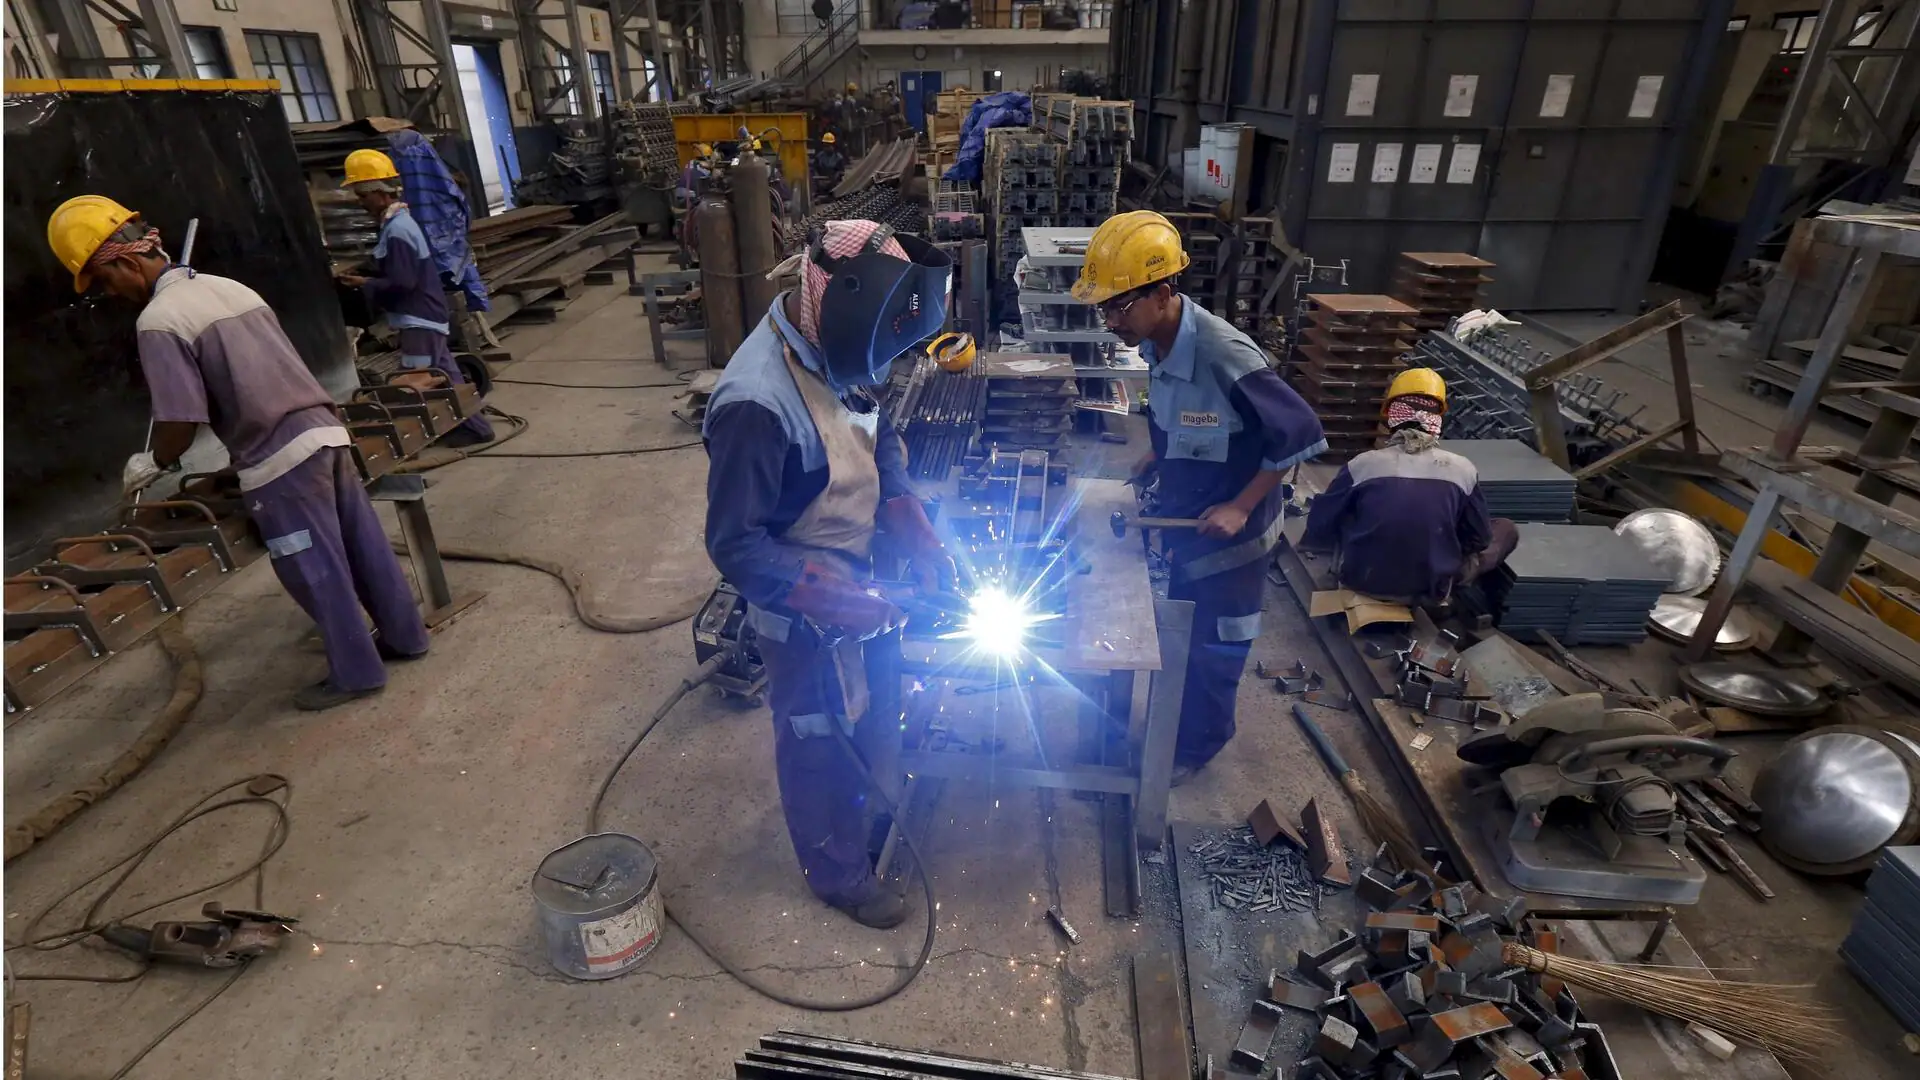
At the end of June, India’s National Statistical Office released figures on the Index of Industrial Production (IIP) for the month of May. The headlines were reassuring. Month-on-month annual industrial growth had recovered from a low of 3 per cent in March to 4.9 per cent in April and 5.1 per cent in May 2026. The downside, however, is that the May growth rate is significantly below the high of 7 per cent registered in November 2025.Monthly growth rates can be deceptive, given the observed volatility of month-on-month growth rates (Chart 1). Moreover, the IIP, while a useful lead indicator that is made available within a month of the reference period, has its inadequacies. Like much of India’s aggregate statistical indicators, it misses out on trends in the large and economically significant informal sector. Data collection is also plagued by non-reporting respondents, resulting in unsatisfactory statistical adjustments for missing values that have an undue influence on the aggregate. So quarterly or annual averages may be more representative of actual trends.Those numbers are disappointing. Quarterly growth rates, having risen from 3.5 per cent in the quarter ending June 2025 to 5.4 per cent in quarter ending September 2025, have fallen to 4.3 and 3.9 per cent respectively in the subsequent two quarters of 2025-26 (Chart 2).Annual averages too point to a deceleration of industrial growth from 6.8 per cent in 2023-24 to 5.7 per cent in 2024-25 and 4.3 per cent in 2025-26 (Chart 3). These trends also corroborate the sense based on reports from the ground that, barring individual sectors like automobiles, industrial growth is losing momentum.New seriesThere is one more reason why these numbers are noteworthy. The IIP estimates issued in May by the NSO, are part of a new series of IIP numbers with 2022-23 as base that replaces the earlier series with 2011-12 as base. Such periodic revisions of the base year are routine. The intent of such revision is to capture the changed structure of the industrial sector both in terms of the relative weights or importance of industry groups covered, as well as to accommodate new groups that have emerged and gained significance, and often are the more dynamic segments of the industrial sector.The new series (2022-23 base) with 455 item groups, has 56 more groups than the series with 2011-12 base, 45 of which are in the manufacturing sector. In addition, the new series has expanded coverage and includes minor minerals, rare earth minerals, gas supply, water supply, sewerage and waste management. Estimates using the new base are available from April 2023.A question that arises is whether the revision of the base year for the index has influenced growth trends in a way that suggests greater dynamism when changes in industrial structure are taken account of. The evidence here is mixed.To start with, while the quarterly growth rates for the two quarters ending December 2025 and March 2026 as indicated by the new series are higher than in the old series, the opposite is true for the two quarters ending June 2025 and September 2025 (Chart 2). That is, the inclusion of new and additional items has not unequivocally raised the rate of industrial growth in recent quarters.In fact, on balance, the new series points to a medium-term deceleration in growth not visible in the earlier series. Annual rates of growth of industry as revealed by the new series decelerated from 6.8 per cent in 2023-24 to 5.7 per cent in 2024-25 and 4.3 per cent in 2025-26. On the other hand, growth as per the old series while showing a sharper fall from 5.9 per cent to 4.0 per cent between 2023-24 and 2024-25, rose marginally to 4.1 per cent (Chart 3). Thus, while the new series points to higher annual rates of growth of industry over this period than the older series, it indicates a persisting deceleration in growth which the old series does not.In sum, the index revision aimed at providing a more accurate picture of industrial performance than the old series did, seems to suggest that the sector has not performed all too well in recent times.Deflator impactThere is however one more statistical shift that may be influencing the picture on industrial performance provided by the new IIP series. Though the IIP is supposed to be an index that captures industrial movements based on shifts in the quantity of production, the output of 234 of the of the 463 item groups included in the IIP basket, which together account for 36.02 per cent of the total weight, is captured in value-based production data. This requires the nominal values of output to be deflated to take account of price changes and isolate the movements in quantities.For this purpose, the old series relies on the indices of wholesale prices of the different groups to deflate the nominal figures.But starting in June the NSO has decided to shift to using Producer Price Indices to deflate the value figures incorporated in the revised index, and adopted the same procedure for all the historical numbers from April 2023. This change in deflator could have affected the output ‘values’ in ways that can account for some of the trends in growth as per the new IIP and the difference, if any, of those trends when compared with the estimates yielded by the index with base year 2011-12.However, this additional element of “noise” affecting the numbers does not seem to be significant. As Chart 4 shows, for the period under consideration, the movements in the producer price and wholesale price indices track each other almost perfectly. The change in deflator used cannot account for difference in trends as revealed by the old and new series.In sum, to the extent that the new series of industrial production indices better represents actual production trends, there is reason to argue that industrial growth in India has been losing momentum, corroborating the message derived from other indicators.Published on July 7, 2026