Space Exploration Technologies Corp (NASDAQ:SPCX) shares are trading marginally higher Thursday morning, performing in-line with the broader Industrials sector, which has climbed over 0.7%. While company-specific news is light for the session, sentiment is potentially being anchored by SpaceX’s decision to extend Starlink connectivity support in Venezuela following recent major earthquakes.Additionally, the stock continues to ride an index-inclusion tailwind. SpaceX is scheduled to join the Nasdaq-100 before the opening bell on July 7, an institutional shift expected to trigger substantial passive buying from index-tracking funds as they rebalance their portfolios.
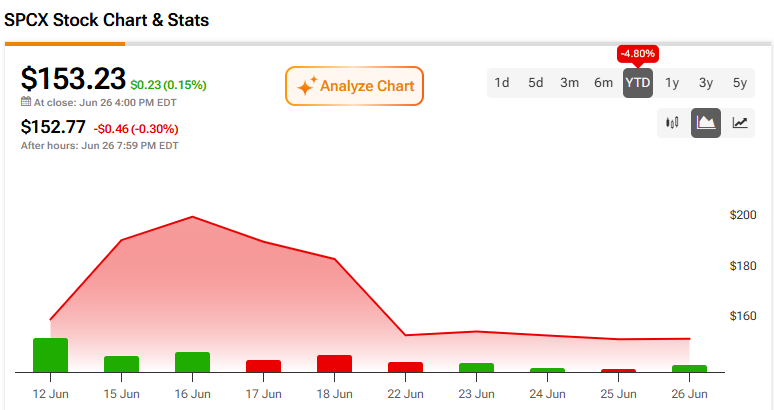
SpaceX stock is trading at depressed levels. What should traders watch with SPCX?
What’s Happening With SpaceX Stock This Week?Starlink says it will provide free internet service through July 25 for new and existing customers in parts of Venezuela hit by twin earthquakes measuring 7.2 and 7.5, after power and telecom damage drove a sharp connectivity drop on Wednesday. The company also said it’s working to rapidly deploy Starlink terminals to the hardest-hit areas, while offering account credits, reactivation credits for previously canceled users, and free replacement kits for damaged equipment.SpaceX has also been in executive-level discussions with Charter Communications about a consumer mobile phone partnership, a potential distribution catalyst for Starlink Mobile’s $10-per-month add-on through T-Mobile. The talks would have Charter route some mobile traffic over its ground-based network, similar to Spectrum Mobile infrastructure rental agreements with T-Mobile and Verizon.SPCX Stock: Critical Levels To WatchFrom a longer-term trend view, the stock is still in a powerful uptrend (up 535.01% over the past 12 months), and it remains well above its major moving averages—about 27.9% above the 20-day SMA and more than 376% above the 200-day SMA. That kind of separation usually signals strong trend control, but it can also mean the chart is vulnerable to sharp pullbacks if momentum fades.Momentum looks more "reset" than "extended" right now, with RSI at 49.35 (neutral), which suggests the stock isn’t currently stretched to the upside or downside. In plain terms, RSI helps gauge whether buying or selling pressure has become overheated; here, it reads like consolidation after a big run rather than a fresh breakout.The moving-average structure is still constructive: the 20-day SMA is above the 50-day SMA, and the golden cross (50-day SMA above the 200-day SMA) that occurred in June continues to reinforce the longer-term bullish regime. With the 52-week high also set in June and the recent swing low in March, traders will often watch whether the stock can build a higher low above that March area to keep the trend intact.