What is a browser-based audio visualizer?
A browser-based audio visualizer is a real-time graphical display that converts live audio signals into visual patterns — waveforms, frequency spectrums, or spectrograms — using the Web Audio API and HTML5 Canvas, entirely on the client side with zero server processing.
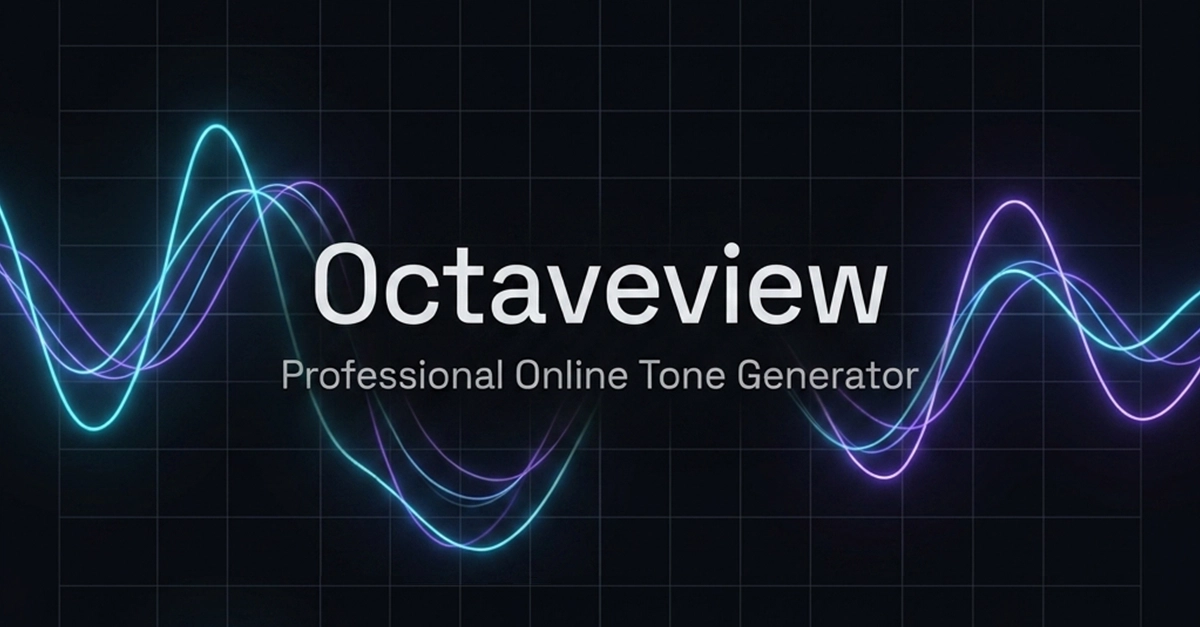
I built Octaveview, a free, professional-grade online tone generator that includes four visualization modes: Waveform (Oscilloscope), Spectrum Analyzer, Dual View, and Heatmap Spectrogram. In this article, I'll walk through the core architecture and techniques I used.
The Web Audio API Architecture
The Web Audio API uses a node graph model. You connect audio nodes together in a chain, from a source to a destination (your speakers). Here's the simplified signal flow I used: