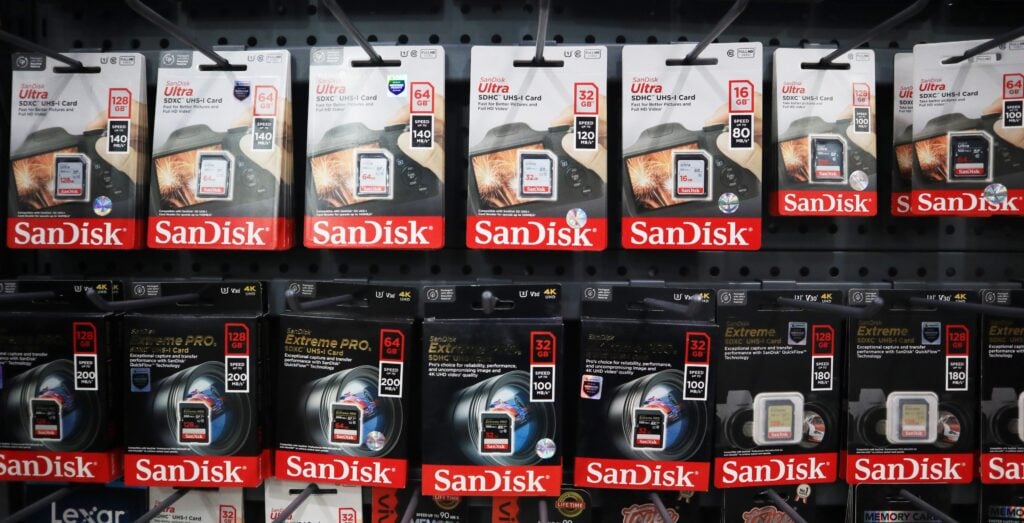
SanDisk shares are retreating from recent levels. What’s weighing on SNDK shares?
What Is Driving Sandisk’s Volatility?The latest narrative has centered on a worsening global shortage of NAND flash memory and SSDs as manufacturers redirect DRAM and NAND capacity toward AI infrastructure, tightening supply for traditional storage products. That backdrop has been tied to heavy data center spending by Alphabet, Microsoft, Meta Platforms and Amazon, which has helped push memory pricing higher.Sandisk’s bull case has also been reinforced by downstream pricing signals: Apple CEO Tim Cook publicly said Apple plans to increase prices across its product lineup as storage and memory component costs surge, calling the cycle "a 100-year flood," per plans to increase prices.Bank of America analyst Wamsi Mohan reiterated a Buy view and raised his price forecast to $2,100 from $1,550, pointing to pricing power and a shift toward multi-year contracts to smooth out cyclicality.Pre-bell, the broader tape is leaning defensive, with Nasdaq-100 futures indicating a 2.7% loss, which can pressure high-momentum names even when the fundamental story is still viewed positively.Critical Price Levels To Watch For SNDKEven with Tuesday’s premarket dip, the longer-term trend remains steeply bullish: the stock is trading 13.8% above its 20-day SMA ($1,796.66) and 227.4% above its 200-day SMA ($624.36), a "stretched" setup that often invites sharp pullbacks on any shift in risk appetite. The moving-average stack is still constructive (20-day SMA above the 50-day, and the 50-day above the 200-day), which is the classic trend-up alignment.RSI is the cleanest momentum lens right now at 72.99, which signals the move is still overbought and therefore more vulnerable to air pockets if buyers step back. RSI simply measures how stretched the recent buying/selling has become, and readings above 70 often mean upside can persist—but volatility tends to rise.Key turning points reinforce that "extended uptrend" framing: RSI first pushed into overbought territory in June, with a June swing high that also marked the 52-week high, following a prior swing low in March. From a levels perspective, traders often watch whether pullbacks can hold above the short-term trend gauges (like the 20-day EMA at $1,823.13) to keep the uptrend intact.