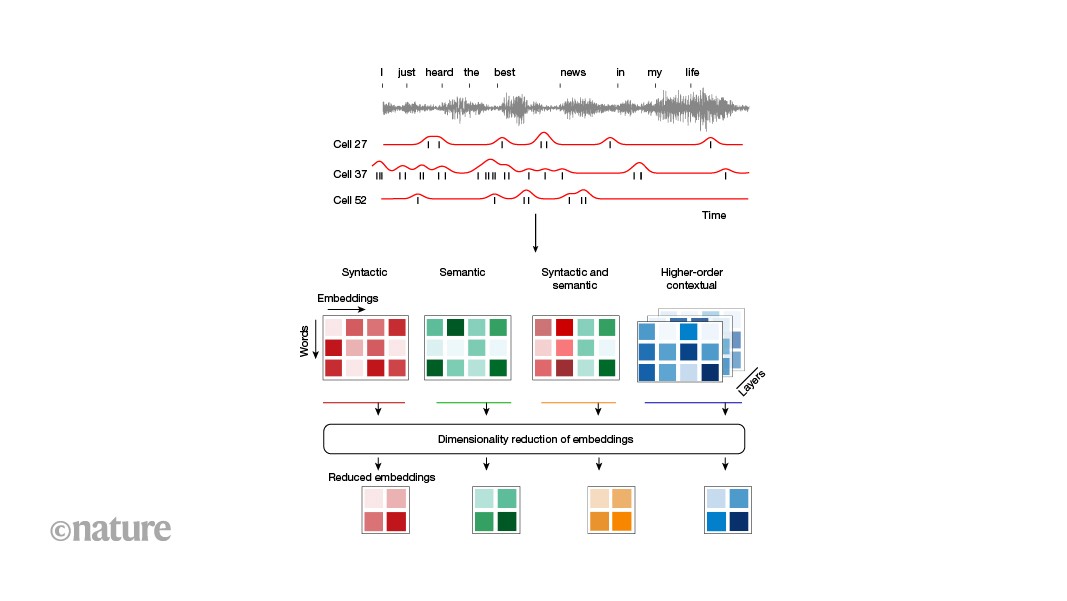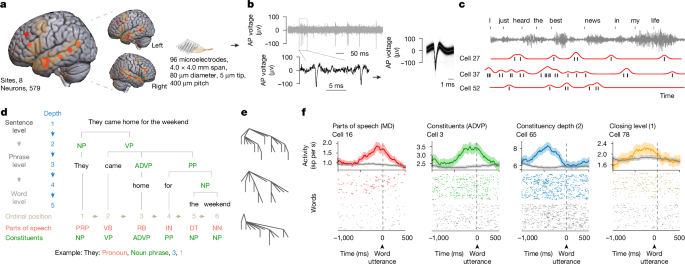
MainLanguage is a fundamental cognitive process unique to humans that allows us to communicate complex and highly diverse meanings. It also enables us to construct new and potentially inexhaustible expressions through grammatical rules that govern how we arrange and combine words and that can generalize across sentences beyond simple repetition. Linguistic studies based on behavioural observations have accurately described how we use the properties of words, such as their grammatical function and syntactic relationships, to construct unique sentences1,2,3. They have also described how we use the hierarchical structure of phrases and sentences to communicate specific ideas and thoughts6. Recent neuroimaging7,8,9,10,11 and electrocorticographic recordings5,12,13,14,15, in turn, have identified broadly distributed regions across the frontotemporal cortex that reliably engage in speech production and sentence construction16,17,18,19 and that differentiate grammatically well-formed sentences from unstructured word lists or sounds, suggesting their sensitivity to syntactic structure20,21. They have also found neural responses that reflect the merger of words into phrases6 and their semantic properties22,23, revealing a broad macroscopic network of cortical areas that could support human language.However, understanding the microscopic organization and cortical landscape by which linguistic information is encoded by neurons in humans or the cellular processes that underlie natural speech has remained a longstanding challenge. While recent investigations have revealed how the phonetic components of words are encoded by neurons24,25, they do not reveal the cellular processes by which we produce meaningful speech or through which we arrange and combine words into phrases and sentences. To convey meaning through language, for example, humans use abstract grammatical categories (such as adjectives and nouns) and dependencies (such as the relationship between nominal subjects and objects) that can generalize across sentences and that can describe complex relationships such as actions and outcomes. Yet, how such grammatical features are encoded by neurons or whether they generalize across sentences largely remains undefined. Little is also known about whether neurons can represent the higher-order syntactic structure of sentences or how they encode their constituent phrases.Another prominent question in neurolinguistics is whether syntactic information is dissociable to some degree from that of semantic information, or how these core aspects of language are represented at a cellular scale26,27. Whereas previous imaging studies have suggested that linguistic information is probably represented broadly across the brain28,29, little is also known about how such information is distributed across cortical regions or whether speech processes are lateralized at a basic cellular level. Finally, little is known about how the local activities of individual neurons and their tuning properties relate to those of the populations’ broader field potential patterns, or what their local organization within the cortex may be.Here we performed single-neuronal recordings across the human frontotemporal cortex and tracked their action potential (AP) and local field potential (LFP) activities over long-term durations as participants produced natural speech. Using speech tracking, parsing, modelling and decoding techniques, we describe the detailed organization and encoding properties of the neurons. We also describe their distribution, regionality and lateralization, together providing a detailed examination of linguistic information encoding during language production at a combined micro (cellular), meso (local population) and macro (regional) scale.Recording neurons during natural speechRecordings were obtained from neurons across the human frontotemporal cortex using semichronically implanted microelectrode arrays (96 channel configuration)30,31,32. These arrays were implanted as part of planned neurosurgical care for epilepsy monitoring30,33,34 and were located in the frontal35,36, anterior temporal20,37 and posterior temporal38,39,40 regions that have been shown to reliably engage in speech production and sentence construction41,42,43 and to display robust language-selective responses41,42,44 by validated language localizers28,41,45 (Fig. 1a). They were also placed in participants who were awake, after implantation, and were therefore capable of producing natural speech, together providing a rare opportunity to study the activities of individual neurons during natural language production (see the ‘Microelectrode recordings’ section of the Methods). In total, we recorded from 579 putative neurons in 8 participants (3 female, 5 male, aged 27 to 52 years) and 14 sessions and only well-isolated single units with stable waveform morphologies consistent with those of cortical neurons were used (Fig. 1b and Extended Data Fig. 1a).Fig. 1: Tracking linguistic representations by neurons across the human frontotemporal cortex during natural speech.a, Sagittal views of microelectrode locations. Eight participants (579 neurons) were recorded from, with four sites located in the left hemisphere (n = 254 neurons) and four in the right hemisphere (n = 325 neurons). An overlay of the recorded sites (left), the recording sites by hemisphere64 (middle) and the approximate microelectrode dimensions (right) are shown. The highlighted areas represent regions that were previously identified to display language-selective responses on validated language localizers28,41,45 and reliably engage in speech production41,42,43,65,66. b, AP voltage tracings and waveform morphologies of well-isolated single units (one example out of n = 579 neurons) at varying timescales (left); each line represents a single AP (right). c, AP activities and raw audio waveforms time-aligned to each word. Spike timings for each cell are shown in black, and firing rate profiles are shown in red. n = 3 out of 579 neurons. d, For illustration, a constituency structure of a sentence, with each word labelled based on its respective part of speech (personal pronoun (PRP), verb (VB), adverb (RB), preposition (IN), determiner (DT), noun (NN)), constituents (noun phrase (NP), verb phrase (VP), adverb phrase (ADVP), prepositional phrase (PP)), constituency depth and ordinal position. e, Constituency structures of three representative sentences. f, Peri-word histograms (top) and raster plots (bottom) of four representative neurons, aligned to the onset of word utterance. The mean ± s.e.m. neuronal activity in spikes (sp) per second (s) is colour coded based on the linguistic feature that the neuron preferentially responded to. The coloured lines and dots reflect the features to which the neurons were preferentially tuned, whereas the grey lines and dots reflect the neuronal activity for all other features (Extended Data Fig. 1b). MD, modal.During recordings, the participants produced various phrases and sentences during natural speech42,43,46,47,48 (see the ‘Language production and audio recordings’ section of the Methods). The sentences were also constructed de novo during natural language production (rather than simply read or repeated) and differed broadly in context and structure (Fig. 1c). For example, the participant may construct a declarative sentence such as “They came home for the weekend” or they may produce a sentence with a subject–verb inversion, such as “When is the payment due?” (Extended Data Table 1a; see the ‘Language production and audio recordings’ section of the Methods). Together, the participants produced 10,460 words across 1,895 sentences, for an average of 747 ± 168 (mean ± s.e.m.) words and 135 ± 28 sentences per neuron per session. All words produced by the participants were transcribed using a semiautomated platform and were aligned to each neuron’s AP activity (see the ‘Language production and audio recordings’ section of the Methods). The participants were English speakers and displayed normal language function on preoperative testing (see the ‘Participants’ section of the Methods).Linguistic representations by neuronsNeurons within the population responded selectively to the linguistic properties of the words. Natural language processing models such as context-sensitive constituency parsers allow for some of the core linguistic properties of words to be reliably labelled and tracked within natural speech1,2,3,49. Thus, for example, whereas the word’s part of speech reflects its grammatical properties (such as an adjective), the sentential constituents reflect how the word or group of words functions as a grammatical unit (for example, within a noun phrase). Furthermore, whereas the word’s constituency depth describes its hierarchical syntactic relationship to other words in a sentence, its ordinal position describes its rank order (Fig. 1d,e, Extended Data Fig. 1a and Extended Data Table 1b). By tracking the neurons’ AP activities in relation to each planned word (pre-articulation period, −400 ms to −100 ms from word utterance; see the ‘Single-neuronal analysis’ section of the Methods) and by using a constituency parsing approach (see the ‘Sentence parsing and linguistic feature labelling’ section of the Methods), we find that 9.2% (n = 53) of the neurons responded selectively to the words’ parts of speech (one-sided Mann–Whitney U-test, α = 0.05, P values were adjusted with false discovery rate (FDR) correction for multiple feature comparisons; Figs. 1f and 2a–c)—for example, transiently increasing their firing rates when the upcoming word was a modal verb (Fig. 1f and Extended Data Fig. 1b). By contrast, other neurons responded selectively to the sentence’s constituents (16.2%, n = 94), whereas 15.9% (n = 92) responded selectively to the word’s constituency depth (distance from the root of the constituency tree) and 11.1% (n = 64) to closing level (phrase mergers). Together, these proportions of neurons were significantly higher than expected from chance (χ2 test, P < 0.05) and remained consistent when randomly subsampling words (bootstrapping test, n = 100, P > 0.05 for all features; Extended Data Fig. 1c). They were also consistent when tested across statistical techniques such as multiple regression analyses and sequential feature selection that accounted for collinearities between features (χ2 test, P > 0.05 with Bonferroni correction across comparisons; Extended Data Table 1c), together suggesting that these neurons reflected the linguistic properties of the words.Fig. 2: Selectivity and robustness of linguistic representations at the cellular scale.a, The proportions of neurons out of n = 579 that displayed selectivity to specific linguistic features (left; Mann–Whitney U-test, α = 0.05, P values were FDR corrected for multiple feature comparisons). Right, coincidence matrix displaying the distribution of cells that displayed selectivity to specific linguistic features. Inset: the percentage of neurons exhibiting overlapping selectivity with lower-order acoustic features (for example, pitch). b, Dependency structure of a representative sentence, with grammatical relationships (dependency), dependency depths and ordinal positions. Here the labels are nsubj (nominal subject), advmod (adverbial modifier), prep (prepositional modifier), pobj (object of a preposition) and det (determiner). c, The proportions of neurons (out of n = 579) that displayed selectivity to dependencies and dependency depth (left; defined as Mann–Whitney U-test, α = 0.05, P values were FDR corrected for multiple feature comparisons). Top right, a coincidence matrix of the distribution of cells that displayed selectivity to specific linguistic features. Bottom right, the number of neurons and their overlap based on their encoding properties including, for example, constituency (const.) depth, dependency (dep.) depth and ordinal position. d, Population decoding performances of individual words for each linguistic feature. The mean performance (triangles) is shown relative to chance levels (dotted lines) and across iterations of train–test splits (histograms, one-sided permutation test; see the ‘Decoding linguistic features from neural activity’ section of the Methods). Additional observation-averaged decoding performances that demonstrate decoding consistency across bootstrapping numbers, training datasets and participants are further shown in Extended Data Fig. 2. e, Dimensionally reduced representation of linguistic features across population neurons (uniform manifold approximation and projection (UMAP); see the ‘Single-neuronal analysis’ section of the Methods). Each selected neuron is colour coded based on the feature to which it displayed significant selectivity. In the case of neurons responding to multiple features, all features are plotted and overlaid.These linguistic representations by neurons were also robust. Using an L2 regularized balanced multinomial logistic regression classifier to predict the linguistic properties of words not used for model training (70:30 split into training and testing; see the ‘Decoding linguistic features from neural activity’ section of the Methods), we find that all of the linguistic features that were tested could be reliably decoded from the neurons’ activity patterns on a word-by-word level (one-sided permutation test, P < 0.05; Fig. 2d). Thus, for example, the activities of the neurons could accurately predict the constituents to which the words belonged when tested on randomly selected words or sentences not used for model training. The highest single-word decoding accuracies were observed for the words’ constituency depth (31.5% observed versus 14.3% chance; one-sided permutation test, P < 10−3, n = 1,000), followed by closing level (27.1% observed versus 11.1%, P < 10−3), constituents (25.1% observed versus 10.0% chance; P = 0.005) and parts of speech (18.4% observed versus 10.0% chance, P = 0.031), with slightly higher decoding performances being found when using observation-averaged activity patterns (Extended Data Fig. 2a,b). The linguistic properties of the words could therefore be reliably decoded from the activity patterns of the neurons.Finally, given the above findings, we examined whether these linguistic representations by neurons were generalizable. By randomly sampling cells from the recorded population and by accounting for their sparse spiking using observation-averaged decoding, we find that decoding performances were similarly significant across all tested features (one-sided permutation test, P < 0.001) and that decoding performances consistently plateaued as the number of tested neurons increased (exponential fit; Extended Data Fig. 2c). We also find similar observation-averaged decoding performances when comparing neuronal activities across the different participants and recording sessions (Friedman test, P = 0.08) as well as similarly significant decoding when examined across all tested features (92% and 86% of all sessions and all participants, respectively; one-sided permutation test, α = 0.05; Extended Data Fig. 2d,e). Lastly, using a natural language processing model to further cluster the words based on variations in their sentence contents (see the ‘Generalizability of linguistic representations’ section of the Methods), we find largely consistent decoding performances for all linguistic features (multivariate linear model, P > 0.05; Extended Data Fig. 2f), suggesting that these linguistic representations by the neurons were not only robust but also generalizable.Specificity of linguistic encodingIn contrast to constituency parsers, whereby a sentence is decomposed into constituent units, dependency parsers principally describe the words’ grammatical relationships, which grow hierarchically based on the relationship between the head and dependent words (Fig. 2b and Extended Data Table 1d). Thus, using a dependency parsing approach (see the ‘Sentence parsing and linguistic feature labelling’ section of the Methods) to further test the specificity of neuronal responses, we find that 10.2% (n = 59) of the neurons responded selectively to the grammatical relationships (dependencies) between the words—for example, changing their activities based on whether a planned word will be the direct object or nominal subject of a governing word. Furthermore, 12.1% (n = 70) of the neurons responded selectively to the word’s dependency depth (Fig. 2c and Extended Data Table 1c), reflecting the hierarchical relationship between the head and dependent word. Overall, both the dependency relationship and depth could be reliably decoded from the neurons’ response patterns (23.2% and 27.2% observed single-word decoding versus 10.0% and 11.1% for chance, respectively; one-sided permutation test, P < 0.05; Fig. 2d), suggesting that these features were represented reliably.Given the above findings, it is possible that the neurons’ responses may be partly explained by overlapping word features—for example, a word can be both a noun and belong to a noun phrase. However, when we evaluated the specificity of the neurons across all possible feature pairs, we found that only 2.2% of them displayed an overlap. Among all the pairs, only parts of speech and dependencies displayed a significant overlap across tests of independence (2.6% of neurons; two-sided permutation test, P = 0.028; χ2 test, χ21 = 18.8, P = 4.1 × 10⁻⁴; Fisher’s exact test, odds ratio = 4.32, P = 2.1 × 10⁻³; Bonferroni corrected for multiple comparisons). We also found little correlation in the degree to which the neurons were modulated by parts of speech and dependencies when compared on a neuron-by-neuron basis (linear regression test, P = 0.18), further confirming that their responses were specific.These neurons also appeared to display a high degree of specificity for features that were closely related. For example, even though the words’ constituency and dependency depths are often highly related, both of which increase with sentence progression, we found little overlap between cells that encoded constituency and dependency depths (one-sided permutation test, n = 1 × 10⁵, P = 0.31 (constituency and dependency depth), P = 0.14 (constituent and dependence relationship); Fig. 2c,e). There was also little overlap between neurons that responded selectively to either the constituency depth or those that simply reflected the words’ ordinal positions (one-sided permutation test, n = 1 × 10⁵, P = 0.33), which also grows with sentence progression, suggesting that these linguistic features were distinguishable at the cellular level.Finally, we examined whether other lower-order aspects of speech, such as the sound-spectral properties of words, could have partly explained these neuronal responses. However, when tracking the words’ acoustic features, we find that, of the neurons that responded to variations in word pitch (12%, n = 72 out of 579 neurons), only a few (≤2.2%) overlapped with any of the neurons that displayed linguistic selectivity (two-sided permutation test, P > 0.1 across all features; Fig. 2a). We also found little difference in the proportions of neurons that displayed linguistic selectivity when considering other related features such as word frequency, length and surprisal (multiple regressions analysis, with added features; see the ‘Single-neuronal analysis’ section of the Methods; Extended Data Table 1c), suggesting that the neurons’ responses were indeed robust to variations in these lower-order speech properties.Combinatorial linguistic encodingAlthough the above findings identified neurons that reliably reflected the words’ linguistic properties, it remained unclear whether and to what degree they encoded their specific combinations. For example, even though the word ‘dog’ in the sentences ‘The dog ate the bone’ and ‘The man walked the dog’ is the same, the specific combination of linguistic features that describe it differs (although the word ‘dog’ is a noun in both sentences, it is a nominal subject in the former and an object in the latter). Similarly, although ‘dog’ and ‘bone’ are both nouns, they hold broadly different semantic meanings1,2,3,49.Therefore, to further study the combinatorial encoding properties of the cell population, we constructed embedding models that could simultaneously capture these features and whereby each linguistic feature (for example, parts of speech, dependencies) was represented by a unitary value (Fig. 3a). Thus, for example, when producing the word ‘dog’ in ‘The dog ate the bone’, these embeddings would reflect not only the part of speech to which the word ‘dog’ belongs but also its constituency depth and serial order as a one-hot vectoral projection (see the ‘Syntactic and semantic embedding models’ section of the Methods). To further account for the semantic properties of the words, we also provided vectoral projections of the words’ meanings based on Word2Vec embeddings27. Lastly, to allow for valid comparison and to limit the possibility of overfitting, we dimensionally reduced the models’ embeddings using a principal component analysis to calculate their predictivity—a measure of how well the models’ embeddings can reliably predict the observed neuronal activity patterns (see the ‘Language model predictivity’ section of the Methods).Fig. 3: Population organization and temporal structure of information encoding by neurons.a, Neuronal predictivity by syntactic (one-hot vectors), semantic (word2vec), a combination of syntactic and semantic and higher-order contextual embeddings (LLaMA Vicuna) was defined as the correlation between the recorded (observed) and model (predicted) activities (see the ‘Language model predictivity’ section of the Methods). b, The distribution, quartiles, 1.5 × interquartile range (whiskers), mean values (thin lines) and median values (thick lines) of population predictivities. Each dot corresponds to a single session (n = 14; grey circle: outlier at −0.3). Chance predictivities are shown in grey. Statistical analysis was performed using one-sided permutation tests (n = 105); contextual features versus syntactic (P = 0.008, 95% confidence interval (CI) = 0.0076–0.058), semantic (P = 0.042, CI = −0.0015–0.069) and combined semantic–syntactic features (P = 0.008, CI = 0.0069–0.054); see the ‘Language model predictivity’ section of the Methods. c, The relationship between context length and population predictivity, with predictive performance plateauing (reaching 1/e) at 5 past words. Data are mean± s.e.m. d, Swap-sentence control (top). n = 14. Data are mean ± s.e.m. Predictivity = −0.01; one-sided permutation test, P < 10−5, n = 105, CI = 0.051–0.063. Bottom, pseudosentence input control. n = 14. Data are mean ± s.e.m. Predictivity = −0.03; one-sided permutation test, P < 10−5, n = 105, CI = 0.069–0.082). e, Normalized contextual model predictivity for the neural population, time aligned to word utterance (left). Right, normalized predictivity across time and network layers for individual neurons, calculated from −2,000 to 2,000 ms (100 ms increments) in relation to word utterance to evaluate contextual integration56,57,67,68,69. f, The average peak predictivities of selective neurons are illustrated by the size of the solid circle; the transparent circle indicates 2 s.d. of the predictivity (note that the datapoints for constituents and dependency overlap). *P < 0.05, **P < 0.01.Here we find that the activities of cells within these populations could be reliably predicted by the specific combinations of linguistic features that defined the words (one-sided permutation test; P < 0.05 for all tested models), with the highest mean predictivity observed for models that included both syntactic and semantic information (mean predictivity = 0.015 ± 0.01 (mean ± s.e.m.); Fig. 3b). However, we also find that most individual neurons preferentially encoded either syntactic information or semantic information alone, with only 1.8% of the cells encoding both syntactic and semantic information for the features tested (binomial test with Bonferroni correction for multiple comparisons, P > 0.05 for all features). Thus, while many of the neurons were preferentially tuned to respond to specific linguistic features, they also reliably encoded information about the combinations of linguistic features that uniquely defined the words.Finally, beyond encoding syntactic and semantic information about the words, these cell populations were also informative of the words’ specific sentence contexts. Here, using large language models24,25 (Vicuna; Extended Data Table 2; see the ‘Higher-order contextual embedding models’ section of the Methods) that could capture the sentences’ contexts (for example, ‘bark’ within ‘The dog has a loud bark’ versus ‘The tree has thick bark’), we find that the contextual model was more predictive of the neurons’ activities than models that simply included the words’ syntactic or semantic features (population predictivity, 0.05 ± 0.01 (mean ± s.e.m.); one-sided permutation test P < 0.05, n = 105; Fig. 3b). Notably, models that incorporated progressively longer context windows (from 2 to 10 words preceding the spoken word) were increasingly predictive of neuronal activity (plateauing at approximately 5 words; exponential fit; Fig. 3c), By contrast, predictivity was at chance when randomly shuffling the sentences in relation to neuronal activity (population predictivity at −1,000 ms = −0.01; one-sided permutation test, P < 10−5, n = 105; Fig. 3d) or when replacing the words spoken with randomly selected tokens (selecting an entirely new set of words; population predictivity = −0.03; one-sided permutation test, P < 10−5, n = 105; Fig. 3d), suggesting that the activities of these neurons reflected the words’ contexts. We also find that the predictivities for the neurons remained consistently high well before word onset (population and single-neuronal predictivity, one-sided permutation test, P < 1 × 10⁻⁵, n = 105; range −2,000 to 2,000 ms, tested in 100 ms increments; Fig. 3e), peaking approximately 1 s before utterance, and displayed a close temporal relationship between the neurons’ peak predictivities, their timings, model layers and linguistic selectivity (regression model, P = 0.02; Fig. 3f, Extended Data Figs. 3–6 and Supplementary Video 1). Together, these cell populations therefore appeared to provide richly detailed representations of the syntactic, semantic and contextual properties of the words before utterance.Diversity and distribution of neuronsCollectively, these neurons were distributed broadly across the recorded cortical areas and hemispheres. Neuronal recordings were made here from frontal35,36, anterior temporal20,37 and posterior temporal38,39,40 regions shown to reliably engage in speech production28,41,42,43 and to display robust language-selective responses41,42,44 by validated localizers28,41,45 (Fig. 1a). By tracking their encoding properties, we find that the proportions of neurons that responded selectively to at least one or more features (289 out of 579) were similar in the frontal, anterior temporal and posterior temporal regions (χ2 test, χ22 = 0.87, P = 0.65). They were also similar when comparing the left to right hemisphere (χ2 test, χ21 = 0.51, P = 0.47; Fig. 4a), and there was little difference in the distribution of neurons based on the particular linguistic features tested (χ2 test, P > 0.05; aside from dependencies and constituents; Fig. 4a), suggesting that they were widely distributed.Fig. 4: Diversity and distribution of neurons across frontal-temporal cortical regions and hemispheres.a, The distribution of neurons across participants, hemispheres and brain areas. Top, the outer ring illustrates the proportion of selective neurons; individual segments are partitioned by participant. The brightness of these segments labels the hemisphere: lighter tones represent the left hemisphere and darker tones represent the right hemisphere. Within the inner circle, grey scales identify the anatomical areas: anterior temporal cortex (dark grey), posterior temporal cortex (mid-grey) and posterior frontal cortex (light grey). Bottom, the proportions of neurons that displayed selectivity for one or more features, grouped by cortical areas and hemispheres (Extended Data Fig. 7a). b, Neuronal modulation across hemispheres and cortical areas. The z score from neurons significantly responding to one or more syntactic features were grouped by hemispheres (top) or brain areas (bottom). One-sided permutation tests (n = 105) yielded the following results: left versus right (P = 0.036, 95% CI = −0.0051–0.11), anterior versus posterior temporal (P = 0.012, CI = 0.014–0.13), anterior temporal versus frontal (P < 10−5, CI = 0.16–0.34) and posterior temporal versus frontal (P = 0.0013, CI = 0.085–0.28). The left subplots display the average z scores across all linguistic features for neurons that responded significantly to any feature; the yellow–green bar indicates the mean and the yellow–orange bar indicates the median of the z scores. The right subplots illustrate the average z scores for neurons selective to each specific feature across hemispheres (top) and across cortical areas (bottom). ***P < 0.001.However, the strength of modulation and the degree to which the neurons were informative of the linguistic features preferentially lateralized to the left hemisphere and differed across cortical regions. Specifically, when we examined the degree of modulation, which reflects the extent to which each neuron changes its activity in response to specific features (their z-scored change in activity; see the ‘Single-neuronal analysis’ section of the Methods), we found that neurons in the left hemisphere displayed significantly stronger modulation than neurons in the right hemisphere (n = 579; rank-sum test, z = 8.06, P = 7.7 × 10⁻¹⁶), including to lower-order word features such as pitch (rank-sum test, z = 4.53, P = 5.8 × 10⁻⁶; Fig. 4b (top) and Extended Data Fig. 7a,b). This difference between hemispheres was consistent across cortical areas (rank-sum test, P < 3 × 10⁻⁶), with the posterior temporal cortex exhibiting the most significant difference (rank-sum test, z = 8.32, P = 9.0 × 10⁻¹⁷). Furthermore, when compared across cortical areas in both hemispheres (Kruskal–Wallis test, H2 = 33.15, P = 6.3 × 10⁻⁸), the strongest modulation was found in the prefrontal cortex (rank-sum test, P < 0.05; for all features except for closing level; Fig. 4b (bottom) and Extended Data Fig. 7c). Neural predictivities from the contextual embeddings were also highest in the left compared to right hemisphere (rank-sum test, z = 3.3, P = 9.5 × 10⁻⁴) but highest in the anterior temporal cortex (Kruskal–Wallis test, H2 = 616, P = 1.6 × 10−134; Extended Data Fig. 7d,e). Thus, even though these neurons were distributed broadly across cortical sites, the strength of modulation and the degree to which they could effectively encode linguistic information appeared to be regionalized and preferentially lateralized to the left hemisphere.Local cortical organizationFinally, we evaluated how the activities of these neurons related to their broader field potential patterns at the local cortical level50. Whereas APs reflect the activities of individual neurons (the basic computational units by which information is encoded), LFPs predominantly reflect the broader synchronous activity of the local neural population, including their synaptic and subthreshold membrane potentials. By tracking their corresponding activities on a site-specific level (with each electrode measuring less than 100 µm in diameter and approximately 5 µm at its tip), we find that many of the sites displayed linguistic selectivity based on their recorded LFPs. Specifically, 23% of the sites (n = 303 of the 1,344 electrode contacts across all arrays) displayed linguistic selectivity, showing consistent changes in LFPs to specific linguistic features (for example, parts of speech; Fig. 5). However, we also find that the proportions of LFP sites that displayed selectivity were significantly lower than the proportion of neurons that displayed selectivity (50%; n = 289 out of 579 across all linguistic features; χ2 contingency test, χ21 = 141.0, P = 1.6 × 10⁻³²) and that most sites in which the LFPs were selective contained no selective neurons (233 out of 303 channels; χ2 contingency test, χ21 = 2.3, P = 0.13). Moreover, only 19% of the electrode sites contained both neurons and LFPs that encoded the same linguistic features (one-sided permutation test, P = 0.33, n = 1,000, Extended Data Fig. 8). Thus, while many of the recorded sites contained LFP signals that were selective, the linguistic features encoded were often distinct from those encoded by the individual neurons when examined at the μm level.Fig. 5: Diversity of single-neuronal and LFP activity patterns.Left, comparison of single-neuronal AP to LFP activities. By having access to both single-neuronal APs and population LFPs from the same microelectrode locations (with each electrode contact measuring approximately less than 100 µm in base diameter and 5 µm at the tip), these two core activity metrics can be compared on a μm scale at a site-specific level. The z scores for all neurons and their LFP activity were recorded at the same microelectrode sites. We then sorted and visualized the single neuronal z scores and applied this same sorting order to the LFP z scores. Middle, the z scores of single-neuronal activities were significantly higher than those from LFPs (two-sided permutation test, P < 10−4, n = 105, 95% CI = 0.19–0.36). Right, LFP response to linguistic features. We identified overlapping responsive LFP channels by counting the instances in which a single channel demonstrated significant responses to two distinct linguistic features simultaneously. The coincidence matrix shows the percentage of channels that significantly respond to one or more linguistic features.Compared with their local field activities, the neurons also displayed a significantly stronger modulation (defined as z-scored differences in activity; two-sided permutation test, P < 10−4) and decoding performances for many of the neurons were significantly higher despite their sparse spiking activities (one-sided permutation test, P < 10−4, n = 10,000 for all features except constituency depth and closing level; Extended Data Fig. 8). Notably, 8.5% (49 out of 579) of the neurons displayed an extreme degree of selectivity to specific linguistic features, as defined by a z score of 2.0 or more51, whereas almost none of the LFP sites displayed such selectivity (1.2%; χ2 contingency test, χ21 = 31.5, P = 2.0 × 10⁻⁸; Fig. 5). Thus, in contrast to the LFP signals, many of the neurons appeared to specialize in encoding specific linguistic features based on their tuning properties.DiscussionUsing wide-scale single-neuronal and local field potential recordings from across the human frontotemporal cortex in combination with natural language processing models, parsing and decoding techniques, we identify a finely detailed representation and partitioning of linguistic information during the production of natural speech. Many of the neurons changed their activities selectively based on the linguistic properties of the upcoming words even when they were closely correlated. They could also reliably predict their linguistic properties even when taken from sentences that differed in their context and topic—suggesting a process that could allow linguistic information not only to be encoded at a cellular level but to also be reliably read-out from the activity patterns of the neurons during natural speech.To construct meaningful speech, linguistic analyses suggest that humans recursively assemble words into larger structures in a way that enables us to convey specific meanings4,5. Here we found cells that reflected not only basic lexical representations such as parts of speech, but that also tracked the higher-order syntactic structure of the sentences, from how the words grouped into phrases to their phrase mergers and order. These neurons responded selectively to these linguistic features while displaying little response to other features such as the sound-spectral properties of speech suggesting a process that could plausibly support the recursive (for example, hierarchical versus serial5,16,52,53 or modular54) nature of language. They also reveal some of the basic building blocks through which the syntactic structure of language can be robustly encoded and that could enable the generative construction of sentences during language production.Collectively, we find that these cell populations provided a richly detailed picture of the words, phrases and sentences being produced. These cells uniquely described syntactic features such as the grammatical relationships between words and their parts of speech. They also distinguished the syntactic properties of the words from their semantic meanings, suggesting that these representations were dissociable at a cellular level. When modelled in aggregate, the activities of these populations could also reliably capture the specific combinations of features that described the words, even when decoded from distinct sentences. They could even capture contextual information about the specific sentences being construction, with contextual model predictivities increasing up to a second or more before utterance—revealing long contextual integration windows55 that are largely consistent with those predicted by prior behavioural56,57 and neurophysiological22,23 studies. Together, such a ‘bookkeeping’ process could therefore allow these cell ensembles not only to provide a combinatorial representation of the words being produced but to also enable their linguistic properties to be encoded at a highly granular level.Another important finding from these recordings is that information encoded by these neurons was distributed broadly across the frontotemporal cortex. Previous imaging studies and more recent electrocorticographical recordings have demonstrated widespread engagement of areas that are more prominent on the left language-dominant hemisphere. These homotopic areas of activation span large parts of the lateral temporal and prefrontal cortices7,8,9,10,11 and have been shown to extend well beyond primary speech regions, such as the ventral premotor cortex41,58. They have also been found to reliably engage in language production and perception by validated language-localizer tasks, together revealing a broad amodal language-selective network of areas that are involved in human speech28,59. Here, consistent with these studies28,60, our observations provide tentative evidence for the distributed but left-lateralized and regionalized representation of linguistic information at the cellular scale. They are also consistent with recent animal studies that have suggested the redundant and distributed representation of sensorimotor information61, suggesting a process that could allow linguistic information to be both widely accessible and concentrated in specialized areas.Finally, when examined locally, we find an interesting distinction between the encoding properties of individual neurons and their populations’ wider field potential patterns. Specifically, linguistic information represented by neurons was found to be largely distinct from that of their LFPs, even when recorded from the same focal cortical sites. Moreover, in contrast to their surrounding LFP patterns, the activities of many of these neurons appeared to be highly tuned to or specialized in responding to specific features, suggesting a hierarchy of information at a microscale level. By providing site-specific AP-to-LFP comparisons, these findings therefore highlight the heterogeneity of linguistic representations at a local population level and offer a prospective link by which to begin bridging our understanding of language processes across study modalities.Together, these findings reveal some of the most basic neural elements that underlie human language and offer a prospective approach for studying its cortical organization at a combined micro, meso and macro scale. Given these observations, it is interesting to conjecture whether similar mechanisms or linguistic representations may be shared between speech production and perception, or whether neural activities may be optimally described by certain language processes5,16,52,53 and models54. Further investigations could also determine whether these findings generalize to other communicative modes, such as writing or scripted speech and further clarify how expressive elements like prosody and tone are represented within these contexts1,2,3,4,5,62,63. Additional studies will be needed to examine neuronal responses from specific eloquent areas, such as the left inferior frontal gyrus, and to record more widely across the brain in order to paint a more complete picture of language production. Here our findings provide an initial starting point from which to begin addressing these questions, and through which to study the basic cellular elements that underpin human language.MethodsSingle-neuronal recordingsParticipantsAll aspects of the study were approved and performed in strict accordance with guidelines set by the Massachusetts General Hospital Institutional Review Board (IRB) and Harvard Medical School for the ethical conduct of research. All of the participants included in the study were scheduled to undergo epilepsy monitoring30,33,34,70. The decision for surgery was made by a multidisciplinary team that commonly included neurologists, neurosurgeons, radiologists and neuropsychologists. Operative planning was made independently by the surgical team and without consideration of study participation. Once the decision to undergo surgery was made, the participant’s research candidacy was reviewed. The participants were enrolled only if the surgical plan was for cortical surface grid recordings for seizure monitoring. The patients were aged at least 18 years, and they had intact language function and were able to provide informed consent. A total of eight participants was included in the study (3 female and 5 male, mean age of 40 years; range, 27 to 52 years). All of the participants that were consented were free to withdraw from study participation at any time without impact on clinical care.Microelectrode recordingsFor each participant, multi-electrode microarrays (Utah arrays; Blackrock Microsystems) were implanted into an area planned for surgical resection. These micro-arrays (used for research) were placed within the cortex in tandem with the surface cortical grids (used for clinical monitoring) and were confirmed to be positioned in areas planned for resection based on intraoperative cortical mapping, as described previously30,71,72,73. The micro-arrays are configured in a 10 × 10 electrode channel mapping separated by 400 μm (96 recording electrodes covering an approximate area of 4 × 4 mm). For placement, the electrode arrays were implanted using a semi-automated impactor and were connected to a temporarily implanted female port. A total of eight arrays was implanted into eight participants. On the left hemisphere, two were in the anterior temporal cortex, one was in the posterior temporal cortex and one was in the prefrontal cortex. On the right hemisphere, one was in the anterior temporal cortex, two were in the posterior temporal cortex and one was in the prefrontal cortex. Together, these recordings lay in regions that have been shown to reliably engage in language production and sentence construction41,42,43,65,66 and to display robust language-selective responses41,42,44,65,74,75,76 and activation by validated language localizers on imaging studies28,41,45 (Fig. 1a). Each participant had a single array. The voltages were recorded and amplified via a 96-multichannel acquisition processor, and a band-pass filter was applied to the neuronal signals (150Hz to 8 kHz; 1-pole low-cut and 3-pole high-cut with 1,000× gain). The signals were then digitized at 30 kHz and stored offline. Audio recordings were tracked and aligned through a synchronization trigger that was integrated into both the neuronal and audio recording systems (Natus Medical). After clinical monitoring, all arrays were removed.Single-unit isolation and LFP processingTo select and cluster APs of putative neurons, an automatic waveform detection was commonly performed using Kilosort 3.0 (https://github.com/MouseLand/Kilosort). The selected APs were then manually curated using Phy (https://phy.readthedocs.io/en/latest/, version 2.0b6). Candidate units were clustered based on their voltage waveform morphologies, spiking rates and their distribution profiles of inter-spike intervals, auto-correlation and cross-correlation profiles. We excluded units that did not demonstrate waveform stability over the course of recordings or that did not have inter-spike-interval profiles or waveform morphologies consistent with those of cortical neurons. Units from different sessions were recorded at separate time periods and across different linguistic contexts and were therefore sorted separately77,78,79. Finally, to confirm the quality of recordings, we used SpikeInterface to extract the measures of the single-unit sorting (v.0.102.3). Here the signal-to-noise ratio was defined as the ratio of the maximum amplitude of the mean spike waveform to the s.d. of the background noise on the same channel. Noise was computed through the median absolute deviation of the peak channel. Isolation distances were used to quantify the separation of putative units from their neighbours in principal component space. Here, after projecting spike waveforms into a lower-dimensional principal component space (across 5 principal components), the isolation distances were calculated using the Mahalanobis distance. Lastly, the inter-spike intervals for each unit were defined by the time intervals between consecutive spikes. Any putative units that had a high percentage of ISIs lower than 2 ms or firing rates lower than 0.1 Hz were excluded. Across all the single units, the mean signal-to-noise ratios were 2.5 ± 0.16 (mean ± s.d.), the mean isolation distances were 37.6 ± 2.7 and the mean peak inter-spike intervals (that is, the mean times that the inter-spike interval distributions peaked) were 8.7 ± 0.4 ms and were largely consistent with previous literature using analogous recording techniques32,80,81.LFPs were obtained from the same electrode contacts as our single-neuronal recordings. Here, for each electrode of the Utah array (96 active channels in total per array), the raw voltages were processed through a series of notch filters to eliminate the AC powerline at 60 Hz and its higher-order harmonics. Then, a fourth-order Butterworth low-pass filter was applied with a cut-off frequency of 300 Hz to capture LFPs. Finally, the filtered signals were downsampled to 1 kHz for downstream analysis.Language production and audio recordingsWe tracked the activities of neurons as part of real-time conversations to study their responses during natural language production42,43,46,47,48,76,82. Here the participants responded freely to questions and prompts that were given ad hoc, therefore allowing them to produce phrases and sentences in a manner that reflected natural speech (Extended Data Table 1). The sentences were also constructed de novo (for example, rather than being simply read or repeated) and therefore enabled neuronal responses to be evaluated independently of explicit sensory cues. Thus, the participant may be prompted with a question such as “Do you want a phone right now?”, to which the participant may respond with the compound sentence “Yes, keep it there just in case, and then just bring that back over”. Therefore, in alignment with growing efforts in the field to study natural language21,42,43,46,47,48,76,82,83,84,85,86,87, the sentences produced by the participants varied naturalistically in structure and content, were constructed de novo and were representative of natural language production.Together, the questions heard by the participants could be divided into 20 main topics and covered wide-ranging fields that included: dates and times, feelings and emotions, spatial locations and orientations, personal descriptions, comfort and reassurances, personal thoughts, conditions and situations, thoughts about specific events, general commentary, health, disagreement and personal conflicts, general activities, opinions, validation and agreement, uncertainty about events, passive questions, active questions, binary questions, visual attributes and social greetings. Quantifying the diversity of question topics across the participants, we also calculated the Shannon entropy of the topics for each participant as: \(H(X)=-\sum _{x\in X}p(x)\log \,p(x)\), where x labels the topics (n = 20), and p(x) is the frequency of prompts belonging to each category. Given that each participant received an average of 14.1 ± 4.9 topics and with a theoretical maximum entropy of 3.0, using an even distribution across 20 topics, we find that the entropy ranged from 1.4 to 2.3, with an average of 2.0 ± 0.3 (mean ± s.d.), meaning that the topics were distributed broadly across the participants.To align each word to the AP activities and LFPs, each word was transcribed and timestamped from the audio data in an automated manner using either Vosk API (16 kHz 16 bit mono; vosk-model-en-us-aspire-0.2) or WhisperX (https://github.com/m-bain/whisperX). After automatic transcription, each word and its timestamp were then manually validated and corrected by an independent scriber (Audacity; v.2.3). Words containing participant-identifying information were replaced by a set of common names that were independent of the participants.Single-neuronal and local field responses to linguistic featuresSentence parsing and linguistic feature labellingA sentence parsing approach was used to identify linguistic features on a word-by-word level as produced by the participants during natural speech. This approach, based on natural language processing models, allows for the basic linguistic properties of words (for example, their parts of speech) to be reliably labelled and tracked1,2,3,49,88. Here we used two complementary parsing techniques.Constituency parsing for each sentence was obtained from the AllenNLP package49,88. Here the word’s part of speech (for example, adverb) was labelled following the Penn Tree Bank, and similar labels were grouped (Extended Data Table 1b; although note that different parsers have also been shown to display differences in labelling)89. The word’s constituent label was determined on the basis of which constituent the word belonged to, and was obtained by traversing the parse tree upward from the word to the next highest hierarchical level. The constituency depth of each word in the constituency tree was determined by the word’s hierarchical distance to the sentence root, and the word’s ordinal position was its order within the sentence. Finally, the closing level was determined by the number of finished phrases after the word was produced (Extended Data Fig. 1a). Words that were not located at the rightmost branch of the parse tree were assigned a closing level of 0, as they did not close any syntactic structures. Levels with a single child node were not counted as an extra level.Dependency parsing for each sentence was similarly obtained from the AllenNLP package49,88 that followed the model of Deep Biaffine Attention for Neural Dependency Parsing90. Built on the verb of a sentence as the root, the dependency tree grows hierarchically with child nodes showing direct dependency on their parent node. Here the grammatical relationship between words (for example, object of a preposition) was determined based on their dependency. To allow comparison across features, the top 10 most frequent categories for each feature were selected for neuronal analysis. For depth, closing level and position, a maximum of 8 was capped on features with excessive layers/number of words with word position then shifted the range to 1–9 (Extended Data Table 1b).Single-neuronal analysis
Mapping the neuronal building blocks of human language with language models - Nature
Wide-scale recordings reveal neurons in the human brain that encode fundamental components of language such as the grammatical relationships between words, their parts of speech and the higher-order syntactic structure of phrases and sentences.
16,409 words~75 min read