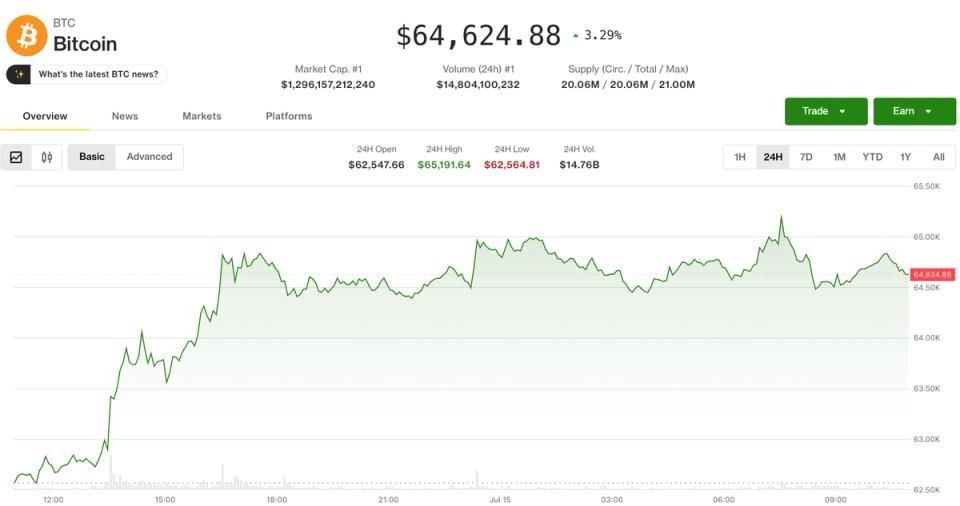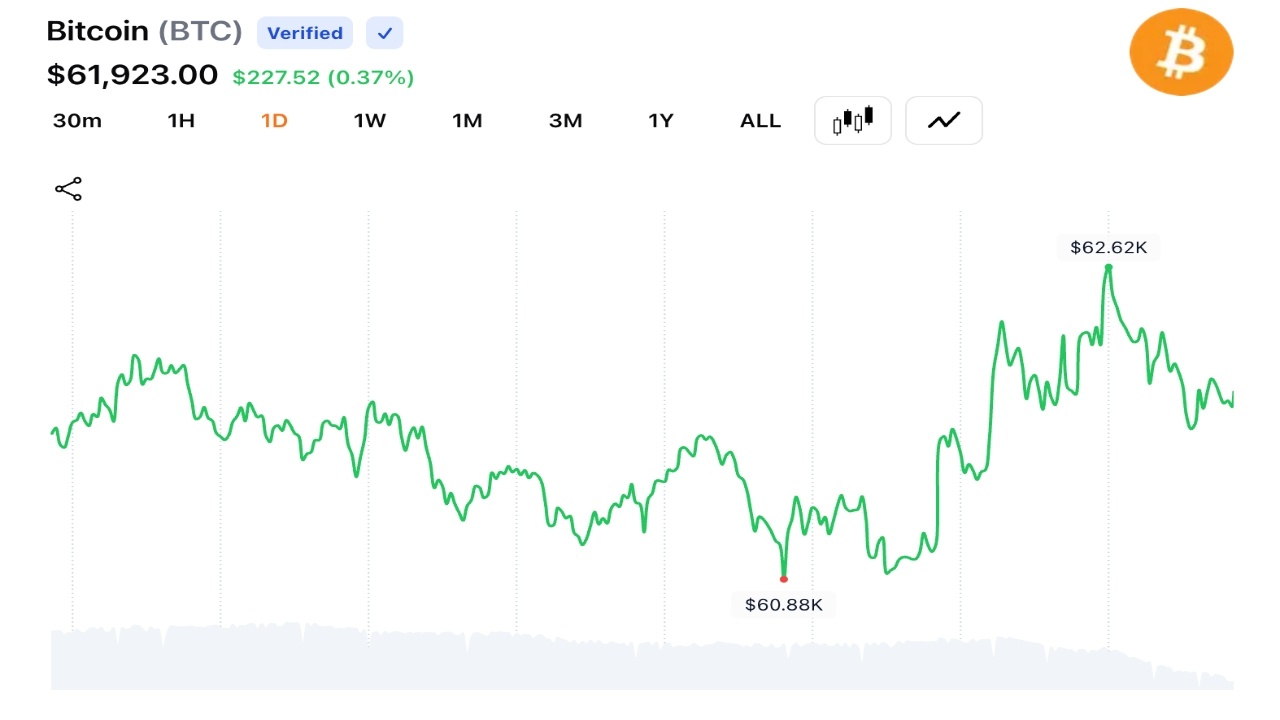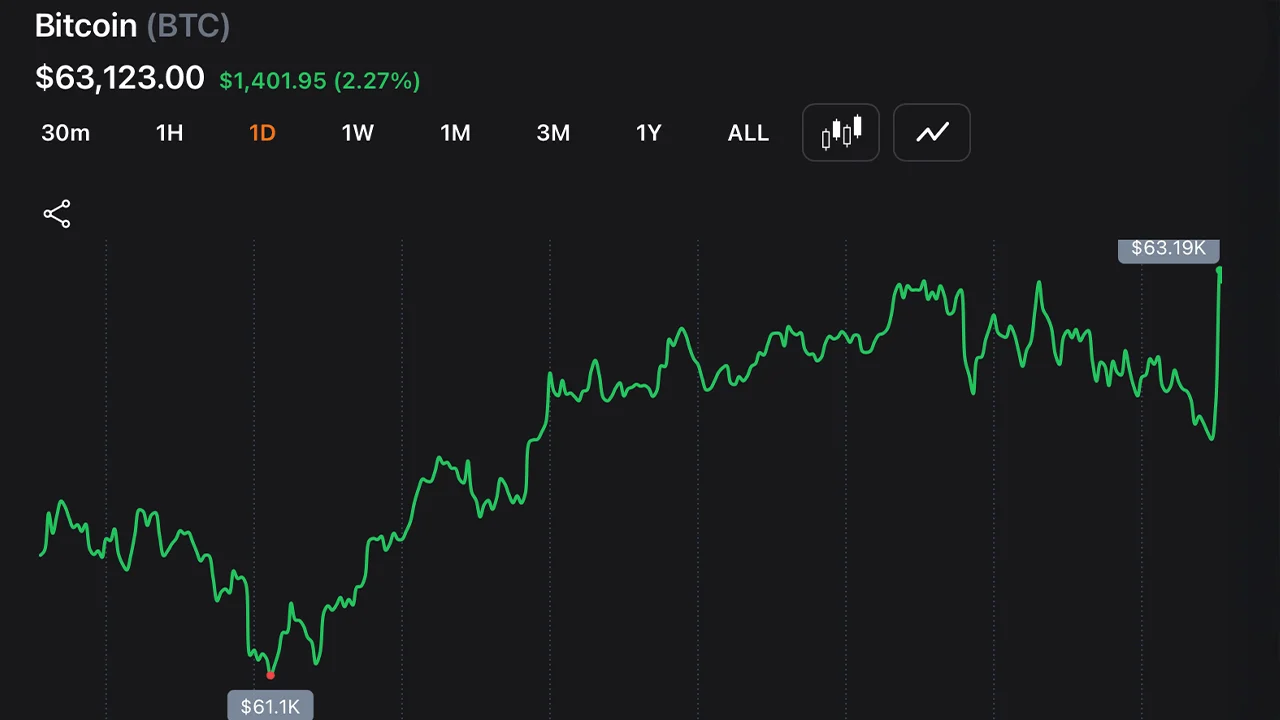
BTC Price Today 08 June 2026: Bitcoin price today is trading near $63,000, caught between a geopolitical relief rally and deep structural headwinds that refuse to disappear. On Sunday, June 8, 2026, a single headline from Washington moved the BTC/USD rate by 5% in under an hour. President Trump stated that Israeli Prime Minister Netanyahu would have "no choice" but to accept a US-brokered ceasefire deal with Iran, calling the agreement "almost complete." Bitcoin jumped from near $60,900 to $64,000 on that news alone — the sharpest single-session recovery in weeks. Yet by Sunday evening, BTC had retreated to $63,000, and there it sits today, consolidating on a knife's edge. That whiplash tells you everything about where Bitcoin price stands right now. It is not a market driven by conviction. It is a market driven by fear, short covering, and macro headlines. Understanding that distinction is the difference between trading this week intelligently and getting caught wrong-footed when real data arrives. The bounce came directly off Bitcoin's June 5 intraday low of $59,100, the weakest BTC price since February 2026. At that low, more than 50% of all circulating Bitcoin sat in unrealized loss — a rare condition that has historically aligned with major cycle lows. Hundreds of thousands of leveraged short positions were liquidated as the Iran news hit, and that forced short-covering amplified the upside sharply. But here is what matters: Bitcoin climbed to a three-week high of $72,841 in early April 2026 when similar Iran de-escalation signals circulated. Each subsequent Iran-related headline has produced 3–5% BTC moves within minutes. The market has been pricing geopolitical war premium into Bitcoin for months. Sunday was simply the latest episode in a pattern traders know well. Why Bitcoin Is Trading as a Macro Sentiment Gauge, Not Digital Gold This is the reframe that most retail traders miss entirely. Bitcoin price today is not behaving like a safe-haven asset. It is behaving like the most liquid, high-beta risk asset in global markets. When Middle East conflict fears escalate, Bitcoin sells harder than equities. When de-escalation signals arrive, BTC rallies faster than equities. Sunday's 5% move fits that pattern with near-mathematical precision. The transmission mechanism behind the Iran-BTC connection is specific and worth understanding. A credible US–Iran ceasefire signal compresses the geopolitical war premium embedded in oil prices. Lower oil pressure reduces inflation risk. Reduced inflation risk eases Federal Reserve hawkishness concerns. Easier Fed expectations improve global liquidity conditions. And Bitcoin, as the most rate-sensitive, liquidity-dependent risk asset, captures that repricing first and fastest. Earlier in 2026, Bitcoin touched $77,000 as Trump's Iran options weighed in markets, and prediction-market wagers on a peace deal swelled into hundreds of millions of dollars. Every incremental signal has moved BTC by 3–5% within minutes. That is not coincidence. That is a market that has assigned Bitcoin the role of a real-time macro sentiment gauge — and understanding that role is critical for predicting BTC price direction this week. The same geopolitical risk that drove Sunday's rally has also been Bitcoin's heaviest drag throughout 2026. Higher oil prices tied to the standoff fed US inflation. Rising inflation complicated the Federal Reserve's rate path. April's headline CPI already came in at 3.8% year-over-year — the highest reading since May 2023. Bitcoin, which peaked near $122,000 in July 2025, has dropped roughly 42% over the past 12 months in this environment. The connection between Fed policy and BTC price is not a theory at this point. It is a data series.Bitcoin Price Prediction: The Chart Levels Defining BTC's Next Move Bitcoin's price chart today shows a market in tight consolidation between $62,500 and $63,000 — the current pivot zone. Price failed to close above $64,000 on Sunday, making that level immediate resistance. A daily close above $63,000 keeps the recovery thesis intact and opens a test of $64,000. A daily close below $61,500 reactivates downside pressure and puts the $59,100 floor back in focus immediately. The $59,100 June 5 low is the number every serious BTC trader is watching. At that level, on-chain data showed more than half of all Bitcoin supply in unrealized loss — a condition that preceded the sharp short-covering wave once the Iran catalyst hit. That low now defines the bottom of the current trading range. Above it, Bitcoin price prediction remains cautiously constructive. Below it, and the next major support traders are watching sits near $58,000. On the upside, a sustained macro relief scenario — softer CPI on June 10, dovish Fed on June 17 — could push BTC price toward $68,000–$70,000, with stronger resistance near $72,000 where the market broke down in recent weeks. Importantly, the Bitcoin daily RSI hit 15.5 on June 7, matching COVID-crash lows from March 2020. Historically, RSI readings at this level have not persisted. They either resolved with a significant bounce or — in rare cases — preceded one final capitulation leg. The market is oversold by nearly every measure. That does not guarantee a rally. But it does mean the asymmetry of risk is shifting. Spot Bitcoin ETF flows add another critical layer to the BTC price outlook. US spot Bitcoin ETFs recorded $519.1 million in net outflows on June 2 alone, following $483.8 million in redemptions on June 1. The 12-day outflow streak totaled $3.58 billion — the largest sustained institutional withdrawal since ETF approval. JPMorgan flagged that even a small Bitcoin sale by Strategy amplified market anxiety and contracted available liquidity. These are not retail-driven moves. Institutional capital is repositioning, and until ETF flows stabilize or reverse, that is a structural headwind for Bitcoin price today.CPI June 10 and FOMC June 17: The Two Events That Decide BTC's Second Half The most important week for Bitcoin price in 2026 is this one. The May CPI report lands June 10. The Federal Reserve's June 17 FOMC meeting — with its dot plot revision — follows one week later. These two events represent the macro framework within which every BTC price prediction for the second half of 2026 must be built. The CPI transmission works through three channels simultaneously. First, headline inflation directly shifts market pricing on the number of Fed rate cuts embedded in the forward curve. Second, that repricing moves nominal Treasury yields. Third, the yield differential between US assets and global assets adjusts the US Dollar Index — the DXY — and Bitcoin, priced in dollars and inversely correlated to global liquidity, responds accordingly. If June 10 CPI prints above 3.6% year-over-year — not a statistical outlier, given April's 3.8% reading and PPI already running at its fastest monthly pace since March 2022 — markets would likely eliminate all remaining 2026 rate cut expectations. The DXY could push toward 107. Global liquidity contracts further. Bitcoin tests mid-$60,000s immediately, and the $59,100 floor comes back into play with force. If CPI prints below 3.0% — a genuine downside surprise — the dot plot shifts toward three 2026 cuts. The DXY moves toward 99. Bitcoin bulls get the macro relief they have been waiting for since April. BTC price could challenge $70,000–$72,000 resistance within days of such a print. The in-line scenario, between 3.3% and 3.6%, likely produces sideways consolidation until the FOMC statement on June 17 resolves the ambiguity. That middle scenario means another full week of elevated volatility and no directional clarity for BTC. Ethereum and XRP sit at similarly decisive technical levels. ETH is testing major historical support near $1,500–$1,587 after breaking below the $2,000 level repeatedly. XRP is defending $1.08–$1.12, a zone that has attracted buyers during previous market stress episodes. A CPI relief rally would likely lift the entire crypto market. A hot print would almost certainly extend the correction across all major tokens.What the Bitcoin Price Story of June 2026 Actually Means Here is the deeper truth that this week's Bitcoin price action is surfacing. BTC has now clearly established itself as the most sensitive real-time barometer of global macro risk appetite. That is not how Bitcoin was originally conceived. But that is what it has become — at least in this cycle. When the Federal Reserve is hawkish, Bitcoin price bleeds. When geopolitical risk spikes, Bitcoin price bleeds. When institutional money rotates out of risk assets, Bitcoin price bleeds first and fastest. And when any one of those pressures reverses — even briefly, even tentatively — Bitcoin price snaps back with amplified force. Sunday's 5% move on a single geopolitical headline is not an anomaly. It is the defining characteristic of BTC in 2026. The Bitcoin Fear & Greed Index at 12 — extreme fear — combined with a daily RSI matching COVID-crash lows and more than 50% of supply in unrealized loss as recently as June 5, creates the kind of technical and sentiment setup that has historically preceded major reversals. That is not a guarantee. Markets can stay oversold far longer than logic suggests. But the structural setup for a significant Bitcoin price recovery exists. What is missing is the macro catalyst to trigger it. June 10 CPI could be exactly that catalyst — or it could push BTC to a new 2026 low. Either way, by the close of this week, the Bitcoin price prediction landscape for the rest of 2026 will look fundamentally different from how it looks today. That is not hyperbole. That is the honest read of a market standing at the edge of its most consequential macro week of the year.
Bitcoin Price Today: BTC fights for $63K as Iran ceasefire hopes, CPI data, and Fed decision loom—will Ethereum, XRP, and Solana surge after critical inflation data?
BTC Price Today Prediction News: Bitcoin trades near $63,000 after rebounding from the June 5 low of $59,100, its weakest level since February. The rally followed renewed optimism around a potential U.S.-Iran ceasefire, briefly pushing BTC above $64,000. Markets now await June CPI inflation data and the Federal Reserve meeting, two events that could reshape crypto sentiment. Ethereum holds near the $1,500 zone, and XRP defends support around $1.10. The next move may depend less on crypto headlines and more on inflation, interest rates, and global risk appetite.
1,570 words~7 min read