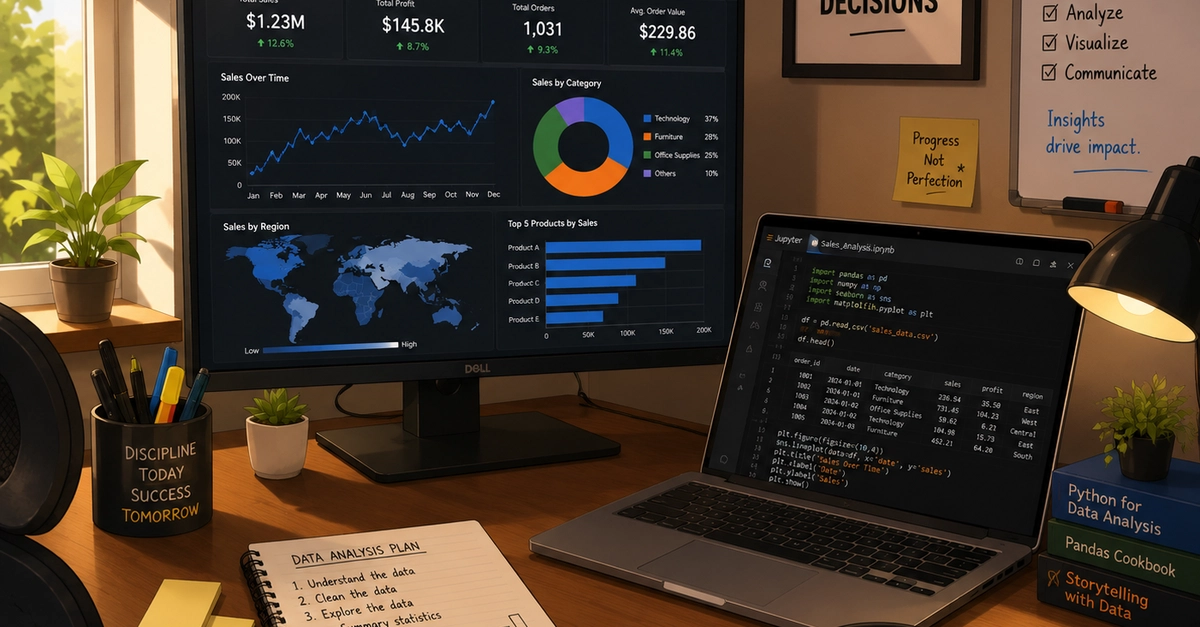
Every once in a while, you will hear the catchy phrase "data is the new gold." This is because organizations and businesses are using data to make decisions, solve problems, and develop actionable insights. Often, the available datasets are messy. Programs such as Microsoft Excel exist to transform the raw, messy data into meaningful insights that can be used to make data-driven decisions.
As a beginner learning data analytics, I have encountered Excel as one of the tools required for my day-to-day activities. I have gained valuable knowledge on cleaning datasets, analyzing, and uncovering trends. In this article, I'll share what I've learnt in my first week, showcase the various uses of Excel in real-world data analysis, features and formulas that I have learnt so far, and give a personal reflection of how learning Excel has changed the way I see data.
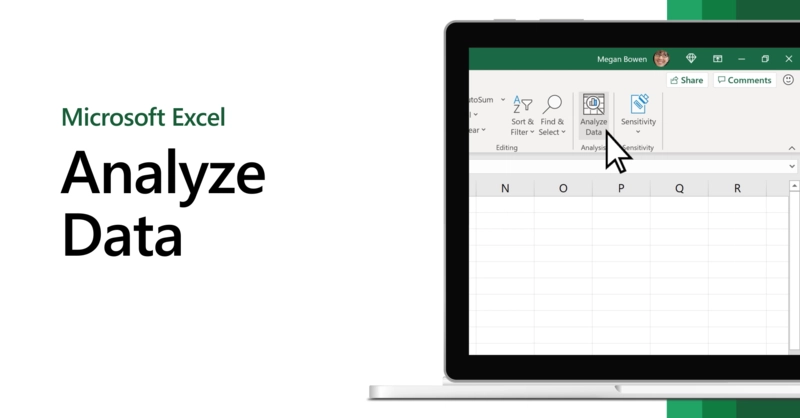
What is Excel?
Microsoft Excel is a spreadsheet software tool that organizes data into rows and columns, making it easier to manage large amounts of information. It allows users to collect, organize, perform calculations, analyze the available trends, and create visualizations.
How Excel is used in real-world data analysis