Quick answer: To measure Twitch chat hype or velocity, pull the full VOD chat using the twitch-vod-chat-archive Actor, load the rows into pandas, bin message_offset_seconds into per-10-second buckets, plot the result, and call scipy.signal.find_peaks on the smoothed curve. Each peak is a moment the crowd lost its mind — mapped back to an exact VOD timestamp for clipping or commentary.
The esports broadcast world produces a peculiar data artefact: 50,000 people typing simultaneously the moment a player lands a one-in-a-thousand play. The Twitch chat scroll goes vertical. That spike — sharp, narrow, unmistakable — is your signal if you are an analyst, a data journalist, or a clip-team producer. The question is how to find it systematically across a four-hour grand final VOD rather than scrubbing the timeline by hand.
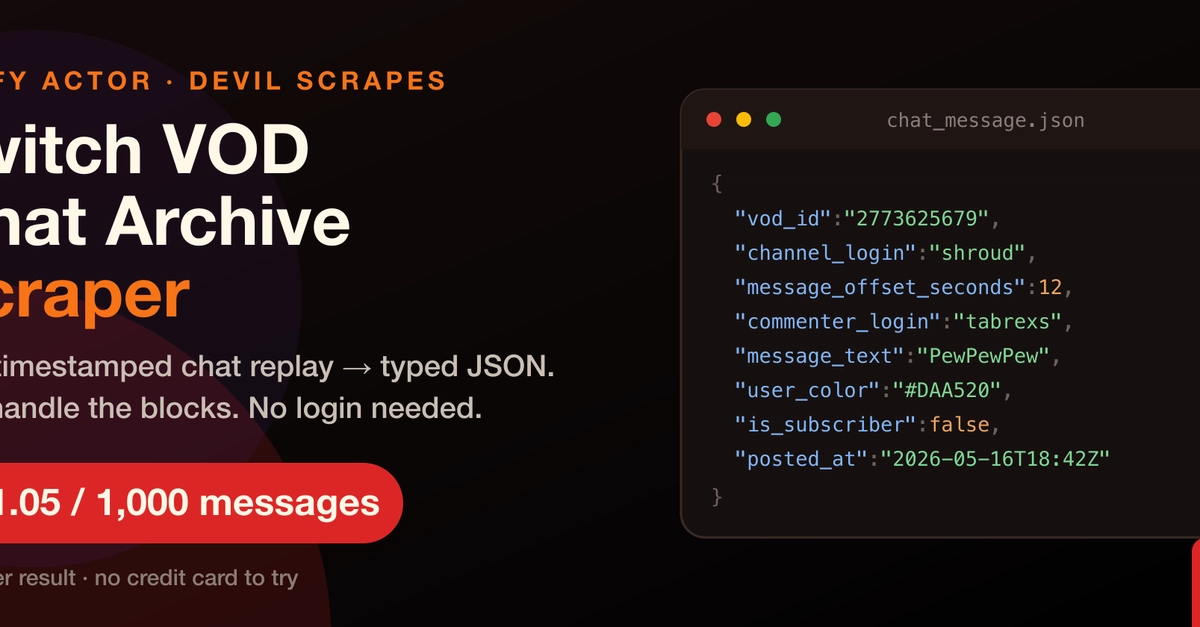
This tutorial shows the full pipeline: pulling a tournament VOD's chat replay, computing message velocity, plotting a hype curve, and extracting peak timestamps automatically.
What is chat velocity, and why does it spike? 📈
Chat velocity is the number of chat messages posted per unit of time, expressed relative to the VOD's timeline. It is distinct from total message count — a 30-second teamfight might produce 800 messages where a 5-minute lull produces 400. Normalised per second or per 10-second bucket, the velocity gives you a comparable signal regardless of how long each segment of play runs.