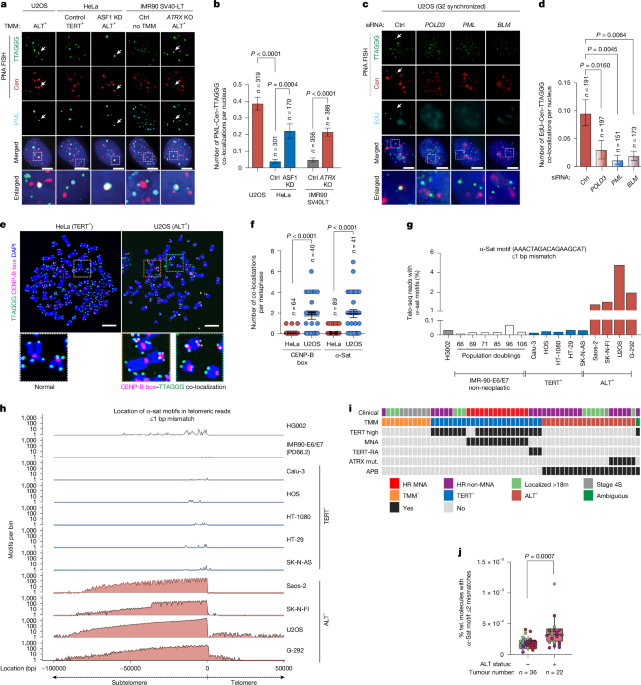
MainTelomeres and centromeres are the most prominent chromosomal landmarks, designating the physical ends of chromosomes and sites for kinetochore formation, respectively2,3. Distinct repetitive DNA sequences define these domains: telomeric TTAGGG repeats4 and centromeric α-satellite (α-sat) higher-order repeat arrays5, typically containing CENP-B box motifs associated with specific evolutionarily conserved nucleoprotein complexes to coordinate the essential functions of each domain. Centromeres and telomeres typically occupy exclusive nuclear territories. Except in specialized instances during meiosis in Schizosaccharomyces pombe6, the compartmentalization of telomeres and centromeres within defined chromosomal domains is considered essential for genome preservation. Here we present evidence for telomere–centromere contacts, centromeric repeat insertions and the establishment of discrete arrays of CENP-A nucleosomes at telomeres in cancer cells that activate the ALT mechanism.Telomere–centromere contacts in ALTThe clustering of numerous telomeres within promyelocytic leukaemia (PML) bodies, forming ALT-associated PML bodies (APBs), is unique to cancer cells that activate ALT1. DNA fluorescence in situ hybridization (FISH) with PNA probes for centromeric α-sat repeats revealed a subset of signals overlapping with telomeres and PML protein in U2OS cells, a standard ALT cancer cell line (Fig. 1a,b and Extended Data Fig. 1a). These contacts were absent in HeLa cells expressing telomerase (TERT+) and in IMR90 SV40-LT-expressing fibroblasts, which lack an active telomere lengthening mechanism. However, the acute ALT activation by ASF1A and ASF1B depletion in HeLa cells7 or constitutive ALT activation by disrupting ATRX (α-thalassaemia/intellectual disability X-linked) protein expression in IMR90 SV40-LT cells8 produced similar frequencies of overlapping centromere–telomere–PML foci (Fig. 1a,b and Extended Data Fig. 1a). Structured illumination microscopy (SIM) analysis of U2OS and IMR90 ATRX-knockout (KO) ALT cells confirmed the close spatial proximity of telomeric and centromeric DNA sequences within PML bodies (Extended Data Fig. 1b and Supplementary Videos 1 and 2). ALT telomere extension involves inter- and intrachromosomal recombination and break-induced replication, stimulated by replicative stress and telomere DNA breaks1. Analysis using Exo-FISH, a single-cell fluorescence assay that detects DNA breaks in unperturbed, asynchronously proliferating cells, revealed frequent overlapping telomere and centromere FISH signals that were visible in U2OS cells, but not in HeLa cells (Extended Data Fig. 1c,d). EdU incorporation was observed at co-localizing telomere–centromeric foci in asynchronously proliferating U2OS cells (Extended Data Fig. 1e,f). The frequency of cells displaying EdU incorporation doubled after synchronization in G2 phase, when ALT activity is maximal and core ALT mediators, PML, BLM and POLD3 are present (Fig. 1c,d and Extended Data Fig. 1e–g). Thus, telomere–centromere–PML contacts are intrinsic to the break-induced replication-mediated ALT mechanism, suggesting that illegitimate recombination may occur between these usually distinct, compartmentalized chromosomal domains in ALT cancer cells.Fig. 1: Centromeric DNA insertions at telomeric regions.The alternative text for this image may have been generated using AI.Full size imagea,b, Representative images (a) and quantification (b) of co-localization between telomeres, centromeres (cen) (α-sat repeats) and PML in U2OS, HeLa cells transfected with control siRNAs or siRNAs targeting ASF1A and ASF1B (ASF1 knockdown; KD), and SV40-LT-transformed IMR90 cells without (control) or with ATRX deletion (ATRX KO). TMM for each line is shown as telomerase (TERT+), ALT+ or no TMM. Data from U2OS and HeLa cells were analysed using one-way analysis of variance (ANOVA) with Dunnett’s post hoc test for multiple comparisons, and comparisons between IMR90 cells were performed using unpaired two-tailed t-tests. c,d, Representative images (c) and quantification (d) of G2-arrested U2OS cells that were transfected with the indicated siRNAs and stained for telomeres and centromeres as in a and EdU. Statistical analysis was performed using one-way ANOVA with Dunnett’s post hoc test for multiple comparisons. e, Representative FISH staining on metaphases from HeLa (TERT+) and U2OS (ALT+) for telomeres and CENP-B boxes. Asterisks indicate CENP-B box signals at telomeres. f, Quantification of telomeres with overlapping CENP-B boxes (left) or α-sat (right) signals. Data are mean ± s.e.m. across three and two independent experiments, respectively. P values were calculated using unpaired two-tailed t-tests. g, The frequency of the 17-bp α-sat motif with ≤1 mismatch across all Telo-seq reads for each cell line. h, Density plots (motifs per bin; y axis) for the presence of a 17-bp α-sat motif with ≤1 mismatch in 500-bp bins of Telo-seq reads normalized to the telomere–subtelomere boundary (x axis). i, 58 patients with neuroblastoma are listed from left to right with their associated TMM. MNA, MYCN amplification; TERT-RA, TERT rearrangement; HR, high risk; APB, ALT-associated PML body. j, Quantification of the frequency of telomeres containing linked-read molecules with at least one 17-bp α-sat motif with ≤2 bp mismatches. The box plot indicates the 10–90th percentiles. n values indicate the number of tumour samples per cohort. P values were calculated using unpaired two-tailed t-tests. For all graphs, data are mean ± s.e.m. across three independent experiments and n values indicate the number of cells/metaphases analysed, unless otherwise specified. Arrows indicate co-localized foci. Scale bars, 10 μm. Source dataCentromere repeat insertion at telomeresIn metaphase FISH analysis, signals corresponding to α-sat or CENP-B box DNA sequences were consistently observed at 2–4 telomeres on chromosomes from U2OS cells, but not HeLa cells (Fig. 1e,f and Extended Data Fig. 1h). We analysed telomere-sequencing (Telo-seq)9 reads derived from a panel of non-cancerous cells (HG002 and IMR90) and TERT-positive (Calu-3, HOS, HT-1080, HT-29, SK-N-AS) and ALT-positive (G-292, Saos-2, SK-N-FI, U2OS) cancer cells to determine whether α-sat or CENP-B box DNA sequences reside within or proximal to telomeres. Notably, the 17-bp α-sat motifs were detected within 1–5% of Telo-seq reads in each ALT cancer cell line (Fig. 1g,h). α-Sat motifs were sporadic but typically not present in Telo-seq reads from TERT-positive cell lines or in HPV-E6/E7 immortalized IMR90 cells cultured towards replicative senescence and cellular crisis (Fig. 1g,h). Further analysis found that an average of 2–3 α-sat motifs are present per kb of Telo-seq reads from ALT cancer cells (Extended Data Fig. 2a). Notably, over 95% of reads containing α-sat motifs aligned to the telomere–subtelomere boundary, rarely mapping within the telomere itself (Fig. 1h and Extended Data Fig. 2b). Full α-sat repeat monomers are 171 bp in length, arranged in a head-to-tail orientation and can exhibit up to 30–50% sequence divergence5. Near-identical frequencies and distributions were identified in ALT Telo-seq reads queried for the 171-bp α-sat monomer sequence with ≤40 bp mismatches, and for the CENP-B box sequence with ≤1 mismatch (Extended Data Fig. 2c–f). Note that the frequency of insertions may be greater, as those located upstream of the EcoRV restriction site used to enrich for contiguous subtelomere–telomere DNA molecules will not be captured in Telo-seq. We posit that the direct insertion and expansion of centromeric DNA elements into telomeres will be detrimental by interfering with the Shelterin complex’s binding to telomere repeats. This contrasted with the location of telomere variant repeats across ALT and non-ALT cells (Fig. 1h and Extended Data Fig. 2g). The exclusive association of α-sat–CENP-B motif insertions with ALT cancer cell lines was notable, especially as particular telomere variant repeats such as TGAGGG and TTCGGG singletons have use in the clinical detection of ALT neoplasms10 (Extended Data Fig. 2h).Telomere length maintenance is a determinant of paediatric neuroblastoma disease progression11. Of high-risk neuroblastomas, 30–40% activate ALT, often coinciding with ATRX loss, and are distinct from cases exhibiting MYCN amplification or TERT gene rearrangements11. Linked-read whole-genome sequencing (WGS) data of 58 neuroblastomas were examined to determine whether telomere-proximal insertion of α-sat motifs occurs in human cancer in vivo. Genomic and molecular criteria12, such as undetectable TERT mRNA expression, ATRX mutations and APB positivity, classified 22 out of 58 (37.9%) neuroblastomas as ALT positive (Fig. 1i). Each linked-read molecule was evaluated for reads containing ≥1 α-sat motif (≤2 bp mismatches) with ≥4 TTAGGG repeats. This analysis determined that the ALT neuroblastomas contain around three times more chimeric α-sat/TTAGGG sequences than the ALT-negative tumours (Fig. 1j). Thus, direct physical contact between these distinct chromosomal domains and the insertion of centromeric DNA elements immediately adjacent to telomeric repeats could represent specific genomic features of ALT cancer cells and tumours.CENP-A footprints at telomeric locationsWe examined whether nucleosomes containing the centromeric histone H3 variant CENP-A are assembled at telomeres in ALT cancer cells. Using fluorescence microscopy analysis to track the localization of newly synthesized SNAP-tagged CENP-A (new CENP-A) molecules13, we observed an approximately twofold accumulation of new SNAP–CENP-A at telomeres in ALT+ U2OS cells compared with in TERT+ HeLa cells (Fig. 2a). U2OS cells exhibited greater telomeric localization of H3CATD—a chimeric histone H3.1 containing the 22-amino acid portion of the centromeric targeting domain (CATD) that fulfils CENP-A’s role in defining centromeric chromatin14 (Extended Data Fig. 3a–d). We next performed cleavage under target and release using nuclease (CUT&RUN)15 analysis to profile the distribution of CENP-A in U2OS and HeLa cells. Most CENP-A reads mapped to centromeric regions and were equally abundant in U2OS and HeLa cell lines (Fig. 2b). However, a small but significant fraction of CENP-A reads mapped exclusively to telomeres in U2OS cells (Fig. 2b), confirming the presence of CENP-A at telomeric regions.Fig. 2: Footprints of CENP-A nucleosomes at telomeric regions.The alternative text for this image may have been generated using AI.Full size imagea, Schematic of the quench–chase–pulse experiment to visualize newly deposited SNAP-tagged CENP-A histones (TMR-Star red, fluorescent dye) at telomeres (TRF2) (top). Bottom, representative IF images and quantification of new CENP-A co-localization with telomeres in HeLa and U2OS SNAP–CENP-A-expressing cells. The arrows indicate co-localization. n values indicate the number of cells analysed. Data are mean ± s.e.m. from three replicates (n = 3 independent experiments). P values were determined using an unpaired two-tailed t-test. Scale bars, 10 μm. b, Illustration of a chromosome with representative browser tracks for CENP-A-bound reads after CUT&RUN that align to centromeres (left) and telomeres (middle) in HeLa (blue) and U2OS (red) cells. The bar graphs indicate the percentage of total CENP-A-bound reads that map to the centromere (top right) and telomere (bottom right). c, Schematic of the DiMeLo-seq assay used to identify the location of CENP-A nucleosomes and DNA methylation by high methylated adenine to adenine (mA:A) and methylated CpG to CpG (mCG:CG) ratios, respectively (top). Bottom, the number of reads (y axis) corresponding to a 5-kb region within the centromere, and a 5-kb region encompassing the telomere–subtelomere boundary (indicated by a vertical black line) for chromosome 11 in HeLa (left) and U2OS (right) cells. prob, probability. d, The mA:A (CENP-A) and mCG:CG (DNA methylation) ratios across 5-kb regions in the subtelomere of chromosome 1 (p-arm, top), 11 (p-arm, middle) and 14 (q-arm, bottom) in U2OS and HeLa cells.Source dataTo locate CENP-A on individual chromosomes, we used DiMeLo-seq, which harnesses antibody-directed in situ adenine methylation by Hia5 methyltransferase to locate CENP-A nucleosome assembly in long-read nanopore sequencing16 (Fig. 2c). After CENP-A DiMeLo-seq in U2OS and HeLa cells, reads were mapped to the telomere to telomere CHM13 assembly, and sites of methylated adenine (mA) were determined, which inferred the location of CENP-A nucleosomes on individual chromosomes. High densities of mA mapping to centromeres on distinct chromosomes (for example, chromosome 11) in both U2OS and HeLa cells were identified (Fig. 2c). Calculating the ratio of mA to A (that is, the ratio of CENP-A present to absent) across telomeres in U2OS and HeLa cells revealed locations of differential low or unstructured/dispersed CENP-A nucleosomes distribution at telomeric locations on chromosomes 2p/q, 7p, 10p, 11q, 16q, 17q and 22p in U2OS cells (Extended Data Fig. 3e). Moreover, locations with a high density of mA indicative of discretely structured CENP-A nucleosomes were identified at telomeres on chromosomes 1p, 11p and 14q (Fig. 2c,d and Extended Data Fig. 3f).DNA methylation patterns can be derived from reads generated by DiMeLo-seq16. Here we found that the methylated CG (mCG) patterns were anticorrelated with CENP-A assembly at telomeric locations. Notably, the CENP-A footprints on chromosomes 1, 11 and 14 were positioned precisely where acute loss of DNA methylation was evident (Fig. 2c,d). The mA:A and mCG:CG ratios revealed that these footprints contain twice as much CENP-A and five to six times less mCG than all other telomeres in both U2OS and HeLa cells (Extended Data Fig. 3f,g). By contrast, telomeric locations with low CENP-A, such as on chromosomes 5p and 20q (Extended Data Fig. 5a–c), or dispersed and unstructured CENP-A on chromosomes 16q and 17q (Extended Data Fig. 5d–f) exhibited 10–20 times more DNA CG methylation than the CENP-A-rich telomeres on chromosomes 1p, 11p and 14q. Lastly, combined telomere, centromere and chromosome-specific FISH confirmed the co-existence of α-sat repeats at each of these telomeric CENP-A footprints (Extended Data Fig. 4a–c). These observations support emerging evidence that acute localized DNA hypomethylation facilitates the organized establishment of CENP-A at centromeres17,18,19,20, and at α-sat insertion sites near telomeres in ALT cancer cells.Modelling the acquisition of centromeric featuresATRX–DAXX stabilizes telomeres and pericentromeric heterochromatic domains by depositing histone H3.3 and maintaining histone H3 trimethylation at K9 and DNA methylation21,22,23,24. Mutations that functionally inactivate the ATRX–DAXX complex are found in 70–80% of ALT tumours and most ALT cell lines, including U2OS10,25. ATRX–DAXX was subsequently designated a putative epigenetic repressor of ALT26. We leveraged the isogenic immortalized IMR90 SV40-LT (no telomere maintenance mechanism, TMM) and IMR90 ATRX-KO ALT cellular model8 to examine the relationship between epigenetic dysregulation and the acquisition of these centromeric signatures at telomeres. ATRX expression was disrupted by CRISPR–Cas9 KO in IMR90 control cells at approximately population doubling (PD) 55 (Fig. 3a). Control (mRosa sgRNA targeted) and ATRX-KO cells proliferated for around 9 weeks before reaching a growth plateau (Fig. 3a). Subsequently, control cells were eliminated through mass cell death. At the same time, the ATRX-KO cultures reinitiated proliferation (Fig. 3a). We examined telomeres in interphase cultures and metaphase chromosomes isolated shortly after ATRX disruption (T1), during the proliferative plateau (T2–T3) and post-plateau (T4). Telomere–centromere contacts and α-sat insertions at telomeres were detected before and during the proliferative plateau at T2 and T3, and at greater frequency post-plateau (T4) (Fig. 3b). Reciprocal insertions of telomere sequences at centromeres on metaphase chromosomes were not apparent at these intervals (Fig. 3c). The appearance of α-sat insertions tracked with ALT acquisition, as indicated by the progressive accumulation of single-stranded telomeric DNA (ssTelo) and APB formation, respectively (Extended Data Fig. 6a,b).Fig. 3: ATRX counteracts centromeric feature acquisition.The alternative text for this image may have been generated using AI.Full size imagea, Growth curves of IMR90 control (grey) and ATRX-KO (green) cells before crisis, during the proliferative plateau and after crisis (ALT+). Cells were processed for immunofluorescence and metaphase analysis at intervals T1–T4. IMR90 control cells were eliminated before T4. b,c, Quantification of metaphase chromosomes from IMR90 control (grey) and ATRX-KO (green) cells at T1–T4 for telomeres (tel) exhibiting overlapping signal with CENP-B boxes and α-sat (b) and centromeres exhibiting overlapping telomere signals (c). Data are mean ± s.e.m. from one longitudinal experiment. n values indicate the number of metaphases analysed. d, The frequency of the 17-bp α-sat motif with ≤1 mismatch across Telo-seq reads from IMR90 control and ATRX-KO ALT+ cells. e, The number of reads (y axis) corresponding to a 5-kb region encompassing the telomere–subtelomere boundary (vertical black line) for chromosomes 11 (p-arm) and 15 (p-arm) in IMR90 control and ATRX-KO ALT+ cells. prob, probability. f, The mA:A (CENP-A) and mCG:CG (DNA methylation) ratios for regions in Fig. 3e. g, Schematic of SNAP–CENP-A labelling in U2OS cells with doxycycline (dox)-inducible allele of ATRX (U2OSiATRX) with ATRX re-expression and DNMT inhibition (decitabine). h, Representative images of new CENP-A at telomeres (TRF2) in U2OSiATRX cells cultured without (ATRX−) or with (ATRX+) doxycycline exposed to DNMTi. The arrows indicate co-localization. i, The frequency of telomeres with new CENP-A. n values indicate the number of cells analysed. Data are mean ± s.e.m. from three replicates. P values are calculated using two-way ANOVA with Tukey’s post test for multiple comparisons. NS, not significant. j,k, Representative images (j) and quantification (k) of endogenous CENP-A molecules at Flag-TET1-CD-WT/mutant telomeric foci in U2OS cells. n values indicate the number of cells analysed. Data are mean ± s.e.m. from three replicates. P values were calculated using unpaired two-tailed t-tests. Scale bars, 10 μm.Source dataTelo-seq analysis of established immortal ATRX-KO ALT cells showed that around 2% of Telo-seq reads contained the 17-bp α-sat motif (≤1 bp mismatch) (Fig. 3d). Once again, in α-sat-containing reads, around two motifs were present per kb of subtelomere (Extended Data Fig. 6c,d). The same patterns were detected for the 171-bp α-sat repeat (≤40 mismatches) and CENP-B-binding box (≤1 mismatch) (Extended Data Fig. 6c–f). To address the more general presence of repetitive elements in telomeric reads in ALT-positive cells, we screened telomeric reads from control and IMR90 ATRX-KO ALT cells for repetitive elements using the Dfam database of repetitive DNA elements27. For each repetitive element, reads with at least one event per read were filtered to identify human-linked repetitive elements. Repetitive elements that were detected in control cells, ATRX-KO ALT cells or both with a frequency of >2% of all reads, corresponding to roughly two chromosome arms, were included in the analysis. In total, DNA sequences from 422 different repetitive elements were present. While the relative frequency of other elements was also altered between control and ATRX-KO ALT cells, centromeric satellite sequences were clearly the most enriched repetitive element in ATRX-KO ALT Telo-seq reads. Notably, whereas α-sats were detected in 2.38% of all telomeric reads from ATRX-KO ALT cells, centromeric satellite sequences were only found in one of 9,038 telomeric reads in control cells (Extended Data Fig. 6g). By DiMeLo-seq, discrete CENP-A footprints like those detected in U2OS cells were identified at the subtelomere–telomere boundary of chromosomes 11p and 15p in ATRX-KO ALT cells, again precisely where pronounced DNA hypomethylation was evident (Fig. 3e,f). Thus, telomere destabilization and epigenetic dysfunction prime α-sat insertion events early in the in vitro evolution of ALT after ATRX inactivation.Restoring ATRX expression in U2OS cells has been shown to attenuate ALT-dependent homology-directed repair and telomere extension by re-establishing telomeric heterochromatin through histone H3.3 deposition and alleviating telomere instability26. In a CENP-A CUT&RUN analysis of a U2OS cell line expressing a doxycycline-inducible ATRX allele (U2OSiATRX), we determined that expression of wild-type (WT) ATRX decreased CENP-A bound to telomeres by about threefold, from 0.27% to 0.10% of total reads. By contrast, CENP-A levels at centromeres remained stable at around 40% irrespective of ATRX expression (Extended Data Fig. 7a,b). These findings were confirmed as indicated by the approximately 50% reduction in YFP–H3–CATD (Extended Data Fig. 7c–e) and SNAP–CENP-A at telomeres in doxycycline-treated U2OSiATRX cells, even with α-sat DNA sequences present at telomeres. When ATRX protein levels subsided after removing doxycycline, new SNAP–CENP-A reaccumulated at telomeres (Extended Data Fig. 7f–i). This indicated that CENP-A deposition at telomeres is highly dynamic yet may depend strictly on ATRX availability. Yet, by treating U2OSiATRX cells with a low dose of decitabine (a DNA methyltransferase inhibitor, DNMTi), new CENP-A was maintained at telomeres despite the presence of ATRX (Fig. 3g–i and Extended Data Fig. 7j). Thus, while ATRX restricts new SNAP–CENP-A assembly at telomeres, even in the presence of α-sat sequences, interfering with DNA methylation is sufficient to promote CENP-A deposition at telomeres. Furthermore, globally inhibiting DNA methylation with DNMTi exacerbated acute ALT activation by depletion of ASF1A and ASF1B in HeLa cells, leading to increased APBs, telomere–centromere contacts and new CENP-A deposition in interphase cells, as well as the telomeric presence of α-sat FISH signals on metaphase chromosomes (Extended Data Fig. 8a–h). Lastly, to directly demonstrate that DNA methylation loss promotes CENP-A assembly at telomeric locations, the catalytic domain of TET1—a 5-methylcytosine dioxygenase that catalyses key steps in DNA demethylation28—was fused to dCas9 and targeted to telomeres in U2OS cells. Here targeting the active dCas9–TET1–CD fusion protein yielded an approximately 1.5-fold increase in endogenous CENP-A at telomeres compared to the inactive dCas9–TET1–CD (Fig. 3h,i and Extended Data Fig. 8i–k). This provided compelling evidence linking DNA hypomethylation to CENP-A assembly at telomeric locations in ALT cancer cells.CENP-A limits MiDAS to maintain ALTThe highly ordered assembly of CENP-A nucleosomes near telomeres suggested that the centromeric chromatin footprints might have functional roles there, which we sought to define. CENP-A deposition is mediated by HJURP29,30. HJURP was also detected by proximity-dependent biotinylation and mass spectrometry analysis of the telomeric proteome in U2OS cells using BirA–TRF1 (Extended Data Fig. 9a). By immunofluorescence, GFP-tagged HJURP localized to telomeres in a panel of ALT cell lines (Extended Data Fig. 9b,c). Maximal GFP–HJURP telomere localization was observed in the late M to early G1 cell cycle stages (Extended Data Fig. 9d–f), when it also deposits CENP-A at centromeres13,29,30. MIS18BP1, CENP-C and CENP-T were also identified with BirA–TRF1 (Extended Data Fig. 9a). Their telomere localization was confirmed in U2OS cells, but not in HeLa cells (Extended Data Fig. 9g,h). CENP-C and CENP-T recruit the NDC80 complex that forms the direct interface between kinetochores and microtubules during cell division31,32,33,34. By immunostaining metaphase chromosomes, CENP-A, CENP-C and NDC80 were detected at telomeric regions containing α-sat insertions, with 1–2 visible instances per metaphase (Extended Data Fig. 10a–f). The mean fluorescence intensity of each of CENP-A, CENP-C and NDC80 at telomeres detected by this assay was approximately 50–60% lower than that at centromeres (Extended Data Fig. 10g). To test whether the loading and density of these centromeric factors at telomeric locations meet the critical thresholds required for active centromere formation sufficient to maintain functional kinetochore–microtubule complexes, we analysed the rates of micronucleus formation that can occur because of chromosome mis-segregation35. We hypothesized that, if the telomeric assembled CENP-A–CENP-C–NDC80 supports microtubule binding, then the chromosome will mis-segregate during mitosis and the rate of micronuclei containing this chromosome will increase. Chromosome 11, which contains α-sat insertions and CENP-A at telomeres, did not mis-segregate into micronuclei more frequently than chromosome 4, of which the telomeres lack these features (Extended Data Fig. 10h,i), indicating that the acquisition of CENP-A, CENP-C and NDC80 only partially establishes centromere function but is not sufficient to maintain functional kinetochore–microtubule complexes. Alternatively, loading telomeres with CENP-A by anchoring full-length HJURP to TRF1 (HJURP(WT)–TRF1) elicited notably greater micronucleation, in contrast to when the HJURP CENP-A-binding-defective mutant (ΔTLTY) or GFP–TRF1 were expressed in U2OS cells (Extended Data Fig. 10j–l). Thus, constraining the abundance of centromeric proteins may be crucial for preserving telomere stability in ALT cancer cells, providing a plausible functional explanation for the insufficient maturation of these centromeric footprints into kinetochores.To gain further insights into how HJURP-mediated CENP-A deposition contributes to the ALT mechanism, the effect of HJURP depletion on telomeres was assessed. HJURP loss strongly decreased the proportion of APB-positive cells in U2OS, LM216J and IMR90 ATRX-KO ALT cells (Fig. 4a,b and Extended Data Fig. 11a). Based on a metaphase FISH analysis, HJURP loss elicited increased telomere loss (signal-free ends) and telomere fragility in U2OS and IMR90 ATRX-KO ALT cells (Extended Data Fig. 11b,c). These data indicate that HJURP positively contributes to maintaining telomere integrity and a productive ALT mechanism. HJURP and CENP-A have been linked with DNA-break-repair processes36. Telomere double-stranded breaks (DSBs) generated using FokI endonuclease fused to TRF1 (TRF1–FokI) activate ALT-associated RAD51/RAD52–POLD3-dependent break-induced replication (BIR)37,38. In contrast to the the catalytically inactive (DA) TRF1–FokI, WT TRF1–FokI expression robustly enhanced SNAP–CENP-A localization to telomere DSBs in U2OS cells (Fig. 4c,d). Consistent with its specificity in depositing CENP-A, HJURP depletion prevented CENP-A accumulation at telomeric DSBs. Moreover, small interfering RNA (siRNA) knockdown experiments revealed that the telomere association of SNAP–CENP-A requires POLD3 and RAD52 (Fig. 4c,d and Extended Data Fig. 11d).Fig. 4: HJURP-deposited CENP-A suppresses telomeric MiDAS.The alternative text for this image may have been generated using AI.Full size imagea,b, Representative images (a) and quantification (b) of the percentage of APB+ cells after HJURP knockdown. P values were calculated using unpaired two-tailed t-tests. c,d, Representative images (c) and quantification (d) of new CENP-A at telomeric breaks in U2OS SNAP-tagged CENP-A cells transfected with Flag-TRF1-FokI WT or catalytically dead (D450A) mutant. P values were calculated using one-way ANOVA with a Dunnett’s post test for multiple comparisons. e, BrdU pull-down dot blots and quantification of the telomere content from U2OS cells transfected with control or HJURP-targeting siRNAs; cells were asynchronous, G2-arrested (nocodazole) and mitosis (G2-arrested with 3 h release). P values were determined using one-way ANOVA with Šidák’s post test. f, Experimental design and representative images of DNA synthesis (EdU) at telomeres on metaphase chromosomes in U2OS transfected with control (con) or HJURP 3′-UTR siRNAs and co-transfected with GFP–HJURP vectors. g, HJURP deletion mutants and quantification of EdU-positive telomeres. P values were calculated using one-way ANOVA with a Dunnett’s post test for multiple comparisons. h, Chromosome showing DNA synthesis (EdU) at telomeres with α-sat insertions. i, Quantification of the frequency of MiDAS events as in Fig. 1h in control and HJURP-depleted U2OS cells. Data are mean ± s.e.m. from four biological replicates. P values were calculated using an unpaired two-tailed t-tests. j, The proposed model. Epigenetic destabilization of telomeres and (peri)centromeres (for example, after ATRX–DAXX mutation) elicits illegitimate heterologous recombination (for example, BIR) within PML bodies, generating centromeric DNA repeat insertions at telomeric locations in ALT cells. Acute and precise DNA hypomethylation at several α-sat insertion sites promotes structured CENP-A nucleosome assembly. Recurrent DNA breaks at telomeres necessitate dynamic α-sat-independent but DNA-break-dependent CENP-A deposition. Together, these cooperate to maintain productive ALT and suppress chromosomal instability and MiDAS. The arrows and asterisks indicate co-localized foci. n values indicate the number of cells/metaphases analysed. Data are mean ± s.e.m. from three biological replicates, unless otherwise specified. Scale bars, 10 μm (a,c,f) and 2 μm (h). NS, not significant.Source dataThese data imply that HJURP-mediated CENP-A deposition at telomeres may specifically contribute to ALT telomere DNA break-induced synthesis. Indeed, capturing and quantifying nascent telomere DNA synthesis during the key cell-cycle phases when ALT is active using immunoprecipitation (IP) analysis of BrdU-labelled DNA (BrdU IP) revealed a substantial increase in telomere DNA synthesis specifically in late M-phase cells, after HJURP depletion (Fig. 4e). Mitotic DNA synthesis, referred to as MiDAS, is a specialized BIR mechanism observed at sites of incomplete DNA replication and replicative stress, particularly at common fragile sites39, telomeres40 and centromeres41. We performed an established MiDAS assay (Fig. 4f), monitoring EdU incorporation at telomeres on mitotic chromosomes (Fig. 4f). Pronounced MiDAS at telomeric sites was only observed in HJURP-depleted U2OS and IMR90 ATRX-KO ALT cells, not in HeLa cells (Fig. 4f,g and Extended Data Fig. 11e,f). Complementing HJURP-depleted U2OS cells with full-length GFP–HJURP abolished this phenotype. However, the expression of two independent CENP-A-binding-defective HJURP deletion mutants, Δ1–80aa and ΔTLTY42, did not (Fig. 4g and Extended Data Fig. 11h), attributing the increased telomeric MiDAS to defects in CENP-A deposition. With the inclusion of α-sat FISH probes, the MiDAS assay revealed that EdU-positive signals emanating from sites of α-sat insertions were more frequent after HJURP depletion (Fig. 4h,i), highlighting the pro-active function of HJURP-mediated CENP-A deposition in protecting against detrimental telomere MiDAS. Accordingly, this MiDAS phenotype required RAD52 and POLD3, both of which are critical for BIR43 (Extended Data Fig. 11i,j). In assessing how other ALT mediators contribute to telomeric MiDAS in HJURP-depleted U2OS cells, the analysis showed that BLM, which is commonly essential for BIR, is not required. By contrast, the multifunctional scaffold protein, SLX4, and translesion DNA polymerase η (Polη) are critical for mediating telomeric MiDAS after HJURP loss (Extended Data Fig. 11i–k). Owing to the replicative challenges and the threat of DNA damage posed by epigenetic dysfunction, HJURP-mediated CENP-A deposition might represent a last-gasp mechanism to maintain telomere integrity and protect against chromosomal instability.DiscussionThe events identified here raise fundamental questions about telomere and centromere interactions in mammalian cells, particularly regarding the circumstances under which telomeres acquire centromeric signatures uniquely in the ALT cancer setting. Our study indicates that chromatin dysregulation and acute DNA hypomethylation, attributed to ATRX–DAXX complex inactivation, prime recombination-directed BIR between these distinct chromosomal domains, culminating in centromeric repeat sequence insertions and CENP-A assembly within discrete pockets of chromatin at telomeric locations on several chromosomes (Fig. 4j). Notably, centromere–telomere recombination is an early event during in vitro ALT evolution after ATRX disruption.The ATRX–DAXX complex functions as a multifunctional epigenetic regulator, coordinating histone H3.3 assembly and DNA methylation at repetitive DNA sequences. Its inactivation compromises chromatin integrity and epigenetic signalling, while also yielding DNA break substrates that can initiate BIR at telomeres21,22,23,24,25,26. Like telomeres, repetitive DNA content and secondary DNA structures leave centromeres susceptible to replicative stress and DNA breaks that are repaired by high-fidelity DNA recombination41,44,45,46. DNA breakage and BIR-mediated recombination underlie the rapid expansion of the centromeric D11Z1 α-sat array on chromosome 11 (ref. 47). Moreover, high rates of DNA breaks within the rDNA arrays on the short arms of acrocentric chromosomes may promote telomere–centromere recombination48. Previous cytogenetic studies have provided evidence of enhanced, simultaneous pericentromeric and telomeric DNA breakage in subsets of ALT cell lines containing minute neo-acrocentric chromosomes49. Recurrent instability, DNA damage and single-stranded DNA accumulation could drive damaged centromeric and telomeric DNA sequences into PML bodies, which are intrinsically linked to recombination via the ALT mechanism (Fig. 4j).The influence of DNA hypomethylation on CENP-A assembly at telomeric locations (Fig. 4j) aligns with evidence that DNA hypomethylation may define the location within centromeres where the critical pool of densely packed CENP-A is positioned for subsequent kinetochore maturation and microtubule attachment17,19,20,50. Constituents of CCAN complex and NDC80 were apparent at telomeres, albeit at lower abundance than at centromeres and less frequently than the insertion of centromeric DNA repeats and CENP-A assembly. Thus, one interpretation is that centromeric signatures were acquired during neoplastic transformation but are tolerated. Indeed, we found that tethering HJURP at telomeres enhanced CENP-A nucleosome assembly and adversely affected genome stability. Thus, limiting the assembly of kinetochore factors at telomeres may be required to preserve telomeres and, by extension, the viability of ALT cancer cells. Our findings indicate that centromeric chromatin signatures may compensate for epigenetic and/or structural alterations in telomeric chromatin, as observed when ATRX–DAXX is inactivated. Blocking HJURP-mediated CENP-A deposition severely abrogated telomere integrity, disintegrated APBs and triggered mitotic telomere DNA synthesis specifically at telomeric locations with α-sat insertions. However, new-CENP-A deposition was also observed at telomere DNA breaks, which, in addition to HJURP, required POLD3 and RAD52. This suggests that CENP-A deposition can be directly coupled to BIR-mediated telomere DNA synthesis, bypassing the need for centromeric DNA repeats. Thus, we propose that CENP-A nucleosome assembly maintains productive ALT and functional telomeres through both sequence-dependent and sequence-independent activities (Fig. 4j). ATRX re-expression alleviates telomere replicative stress, single-stranded DNA and DNA breaks26. Thus, the disruption of CENP-A deposition observed after ATRX reintroduction in U2OS cells could reflect the suppression of the DNA-break-dependent CENP-A deposition pathway, even though the centromeric DNA insertions remain available for CENP-A assembly. Different patterns of discretely structured and unstructured/dispersed CENP-A nucleosomes at telomeres could reflect distinct, stable sequence-dependent pathways and DNA-hypomethylation-dependent mechanisms, versus the dynamic DNA break-dependent placement of CENP-A at telomeric locations. Collectively, the events uncovered here represent a powerful demonstration of the adaptive forces that shape and maintain telomeres to bypass damage-imposed barriers in the cancer-specific context of ALT. The selective detection of these rearrangements in ALT cell lines and ALT tumours substantiates their potential pathobiological importance. Future studies will be essential to examine their prevalence and associated risks in ALT neoplasms.MethodsCell LinesU2OS (ATCC; HTB-96), Saos-2 (ATCC; HTB-85) and HOS (ATCC; CRL-1543) cell lines were obtained from ATCC. The HeLa (LT, long telomere) cell line was validated using short-tandem-repeat profiling by ATCC’s cell line authentication services. The LM216J/T cells (described initially by J. P. Murnane) were provided by R. Greenberg. U2OS cells with a doxycycline-inducible ATRX allele were provided by D. Clynes26. SV40 large T-antigen immortalized IMR90 control and ATRX-KO ALT IMR90 cells were previously described and provided by H. Zheng and J. Paik8. U2OS cells stably expressing SNAP-tagged CENP-A were provided by G. Almouzni13,29. All of the cell lines were cultured in GlutaMax-DMEM supplemented with 10% bovine growth serum or fetal calf serum, non-essential amino acids and penicillin–streptomycin under 20% O2 and 7.5% CO2 at 37 °C. Cell lines were routinely tested for mycoplasma contamination. PlasmidsY. Dalal previously described and provided the GFP-tagged HJURP WT plasmid51. The GFP-tagged HJURP deletion mutants, Δ1-80aa and ΔTLTY box42, were generated as variants of this plasmid in this study. D. R. Foltz provided GFP-tagged Mis18BP1 (ref. 52) and YFP-H3CATD (ref. 30). pBabe-SNAP-CENP-A-HA were previously described and provided by L. Jansen13. Flag-tagged TRF1-FokI WT and D450A plasmids were gifts from R. Greenberg37,38. pINDUCER dCas9-TET1-CD plasmids53 were gifts from D. Huangfu (Addgene, 101920 and 101921). Lentiguide-puro54 was a gift from F. Zhang (Addgene, 52963) and used to express sgTel (TTAGGGTTAGGGTTAGGGTTAGG) for telomere targeting. Underlined bases indicate PAM sequence.Direct IF analysisFor immunofluorescence (IF) analysis in Figs. 1a and 4a, cells were plated on glass coverslips, washed with PBS and fixed with 2% paraformaldehyde (PFA). After two more washes with PBS, cells were permeabilized (0.05 g of sodium citrate and 0.1% (v/v) Triton X-100) for 5 min, then washed and incubated in a blocking solution (1 mg ml−1 BSA, 10% normal goat serum, 0.1% Tween-20) for 30 min. Cells were incubated with primary antibodies diluted in blocking solution at 4 °C overnight. Next, cells were washed three times and incubated with Alexa-conjugated secondary antibodies (Life Technologies) for 1 h at room temperature. Cells were then washed three times with PBS, fixed using 2% PFA for 10 min and washed twice with PBS. Lastly, cells were dehydrated using a series of ethanol washes (70%, 95% and 100%), air-dried and mounted onto slides with Prolong Gold Anti-fade reagent with DAPI (Life Technologies). Imaging was conducted using conventional fluorescence with a ×60 Plan λ objective using a Nikon 90I.For all other IF-related experiments, cells were plated onto glass coverslips, washed once with PBS and then permeabilized using cytoskeleton (CSK) buffer (10 mM HEPES, 300 mM sucrose, 100 mM NaCl and 3 mM MgCl2 supplemented with 0.5% Triton X-100) for 10 min. Cells were then fixed in 2% PFA for 10 min, washed twice with PBS and incubated in blocking solution for 30 min. Primary and secondary antibody incubations were performed as above, and then the cells were fixed, washed, ethanol-dehydrated and mounted. Imaging was conducted with conventional fluorescence using a ×60 Plan λ objective on the Nikon 90I system. Single z stacks (0.5 µm sections) were acquired and analysed. No maximum-intensity projections were used in co-localization experiments. Antibodies used in immunofluorescence: TRF2 (1:1,000, Novus Biologics NB110-57130), TRF1 (1:1,000, Abcam ab10579), PML (1:100, Santa Cruz, SC-966), CENP-C (1:1,000, MBL, PD 030), CENP-T (1:500, Bethyl Laboratories, A302-313A) and Flag M2 (1:1,000, Sigma-Aldrich, F1804).IF-FISHAfter the ethanol dehydration step in IF, coverslips were air-dried. Next, the coverslips were incubated with hybridization mix (70% deionized formamide, 1% maleic acid with 1 mg ml−1 of blocking reagent (Roche), 10 mM Tris-HCl, pH 7.5) containing the appropriate PNA probes at 72 °C for 10 min and then kept in the dark at room temperature overnight. The coverslips were then washed twice for 15 min each with PNA wash A (70% deionized formamide and 10 mM Tris-HCl, pH 7.5) and three times for 5 min with PNA wash B (0.1 M Tris-HCl, pH 7.5, 0.15 M NaCl and 0.08% Tween-20). Ethanol dehydration was performed as described above; the coverslips were air-dried and then mounted in Prolong Gold Anti-Fade reagent with DAPI. Tel (F1004, F1013), CENT (F3003) and CENP-B (F3005) PNA probes were purchased from PNA Bio.siRNA transfectionsIn total, 300,000 and 800,000 cells were seeded into 6 cm or 10 cm plates. Then, 50 nM siRNA was diluted in Opti-MEM medium with 2.5 μl and 5 μl of DharmaFECT transfection reagent per 6 cm or 10 cm plate, respectively. For IMR90 SV40-LT control and ALT cells, the volume of Dharmafect reagent was doubled to ensure proficient knockdown. The siRNA–Dharmafect mix was added to the cells for 16 h, after which the medium was replaced. Cells were collected for western blot or immunofluorescence analysis at 72 h. Premade siRNA pools were purchased from Horizon Discovery (RAD51, L-003530; RAD52, L-011760; BLM, L-007287; SLX4, L-014895; POLH, L-006454; POLD3, L-026692; ASF1a, L-020222; ASF1b, L-020553; PML, L-006547; non-targeting (NT) siRNA: D-001206-13). The sequences of the custom-synthesized siRNAs are HJURP 1: 5′-CUACUGGGCUCAACUGCAAUU-3′29; HJURP 2: 5′-GUGUGUAGCUAGGUUAUUUUU-3′29; HJURP 3′-UTR: 5′-GAGAUAACCUCGAGUUCUUUU-3′55.Telomere DNA synthesis detection by EdUU2OS and HeLa cells were left either unsynchronized or synchronized in G2 with RO-3306 (Sigma-Aldrich; 10 μM) for 22 h before collection. Cells were pulsed with EdU (10 μM) 1 h before collection. Cells on glass coverslips were washed twice in PBS and fixed with 2% PFA for 10 min. Cells were permeabilized with 0.1% (w/v) sodium citrate and 0.1 % (v/v) Triton X-100 for 5 min. Cells were then washed with PBS and underwent serial ethanol dehydration before FISH as described above. After washing, the Click-IT Plus EdU Cell Proliferation Kit with Alexa Fluor 647 (Invitrogen) was used to detect EdU. When performed in conjunction with siRNA depletion, knockdowns were performed as detailed above, and the cells were analysed at around 72 h after knockdown. Imaging was conducted with conventional fluorescence using a ×60 Plan λ objective on the Nikon 90I system.Sim analysis using DeepSIMImage acquisition uses the Nikon Ti inverted microscope platform with a Plan Apo VC ×60 objective (NA 1.4), CrestOptics X-Light V3 spinning disk and Deep SIM scanhead, and a Photometrics Kinetix sCMOS camera optimized to acquire four fluorescent channels at excitation wavelengths 405 nm, 488 nm, 561 nm and 647 nm. The entire nuclear volume is sampled at the Nyquist frequency in x, y and z using the standard (37-image) microlens array mode, calibrated to focus lens position 1000, to produce a series of 1,024 × 1,024 16-bit single-plane images with a 200 nm step size. Images are reconstructed and projected in 3D using the Crest DeepSIM reconstruction plugin and NIS-Elements software.Exo-FISHExo-FISH was performed as previously described with slight modifications45. Cells were collected by trypsinization, washed in PBS and 200,000 cells were swollen in 0.56% KCl for 20 min. After 5 min of centrifugation at 1,000 rpm, cell pellets were fixed in 3:1 methanol:acetic acid for 20 min, and then a consistent number (around 20,000) was homogeneously spread onto glass slides. After drying overnight at room temperature in the dark, slides were rehydrated in PBS for 5 min at room temperature. The following treatments were performed in a humidified chamber: slides were treated with 0.5 mg ml−1 RNase A (Invitrogen) for 10 min at 37 °C, then incubated with buffer only (−exo) or with 500 mU μl−1 exonuclease III (Promega) (+exo) for 30 min at 37 °C. Slides were hybridized with a fluorescently labelled PNA probe specific for the telomere or centromere α-sat sequence (PNA Bio) and incubated at room temperature for 90 min. Slides were washed, dried and mounted as described for IF-FISH and metaphase spreads. Imaging was conducted using conventional fluorescence with a ×60 Plan λ objective using a Nikon 90I.Telo-seqTelo-seq was performed as described9, with modifications for the R10 flow cell chemistry according to the instructions of Oxford Nanopore Technologies. Samples of IMR90 SV40 control and IMR90 ATRX-KO LT were sequenced using R10 flow cell chemistry. In brief, high-molecular-mass genomic DNA (gDNA) was extracted using the NEB Monarch HMW DNA extraction kit for cells and blood (NEB, T3050) according to the manufacturer’s instructions and quantified using the Qubit dsDNA BR assay (Invitrogen, Q32853). Telo-adapter oligonucleotides (T1–T6, 40 μM final concentration; see the list below) were individually hybridized with the Telo-splint oligonucleotides (40 μM final concentration; see the list below) in annealing buffer (50 mM NaCl, 2 mM Tris HCl, pH 7.5, 1 mM EDTA final concentration) using a thermocycler (Bio-Rad, C1000) (5 min 95 °C denaturation followed by gradual −0.1 °C per cycle decrease in temperature for 850 cycles). Annealed adapters were mixed in equal parts (6.6 μM final concentration each). In a final volume of 200 μl, 15 μg gDNA was mixed with 1 mM ATP (Thermo Fisher Scientific, R0441), the telo-adapter mix (final concentration 100 nM, each), 50 U μl−1 Quick T4 DNA ligase (NEB, E7180) in 1× rCutsmart buffer (NEB, B6004) and incubated at 35 °C for 16 h followed by heat inactivation at 65 °C for 10 min. The reaction mix was digested with 80 U of EcoRV-HF (NEB, R3195) at 37 °C for 30 min, then heat-inactivated at 65°C for 20 min. Next, the digested sample was treated with 1 mM Klenow fragment (3′−5′ exo-; NEB, E6053) in 250 μl 1× NEBNext dA-tailing reaction buffer (NEB, E6053) at 37 °C for 30 min to perform dA tailing. Then, 250 μl AMPure XP beads (1×, v/v) (Beckman Coulter, A63881) were added to the dA-tailing reaction, incubated at room temperature for 5 min, spun down on a magnet, washed twice with 80% ethanol and resuspended in 198 μl water. The sample was incubated at 37 °C for 15 min, then spun down using a magnet. 196 μl dA-tailed sample was incubated with 100 nM Telo-splint in the presence of 50 mM NaCl at 50°C for 1 h. Annealed DNA was purified using 100 µl of AMPure XP beads (0.5×, v/v), as described above, with 32 µl of water used to elute DNA. Next, 5 μl of Native Adapter (Oxford Nanopore Technologies (ONT), EXP-NBA114) was ligated to 30 μl of the sample using 5 μl Quick T4 DNA ligase in 1× NEBNext Quick ligation reaction buffer at room temperature for 20 s followed by purification with 25 μl AMPure XP beads (0.5×, v/v), as described above using 14 μl elution buffer (ONT) to elute the library. The 12 μl library was further processed according to the manufacturer’s instructions and loaded onto the R10.4.1 MinION flow cell (ONT, FLO-MIN114). The library was sequenced on a GridION sequencer (ONT). One flow cell was used per library. R10 reads were basecalled using SUP model (v.4.3.0) and telomeric reads were identified as described9.Telomeric reads were identified as described9. Telomeric reads were searched for the presence and location of α-sat motif (5′-AAACTAGACAGAAGCAT-3′), CENP-B probe (5′-ATTCGTTG GAAACGGGA-3′) and α-sat consensus sequences (5′-AGCATTCTC AGAAACTTCTTTGTGATGTGTGCATTCAACTCACAGAGTTGAACCTTCCTTTTGATAGAGCAGTTTTGAAACACTCTTTTTGT AGAATCTCCAAGTGGATATTTGGAGCGCTTTGAGGCCTTCGTTGGAAACGGGAATATCTTCACATAAAAACTAGACAGA-3′)5 using the Seqkit (v.2.6.1)56 command ‘seqkit locate -f motifs.fa seqkit_ input_ telomeric_reads.fasta --max-mismatch x > seqkit_ output_file.txt’ in conda (v.23.11.0) where x is the maximum number of allowed mismatches. Telomeric reads were also searched for the presence of singleton telomeric variants in the following pattern (5′-TTAGGGTTAGGGTTAGGG-TNNGGG-TTAGGGTTAGGGTTAGGG-3′) using the command ‘seqkit locate -r -p ‘(TTAGGG){3} (TNNGGG)(TTAGGG) {3}' seqkit _input _telomeric_ reads. fasta > seqkit_output_file.txt’. Four variant motifs (TCAGGG, TGAGGG, TTCGGG and TTGGGG) were each searched for and flanked by three consecutive canonical (TTAGGG) repeats on either side. Data were further analysed and plotted using R (v.4.3.1) with packages dplyr (v.1.1.4), gggenes (v.0.5.1), ggplot2 (v.3.5.1), scales (v.1.3.0) and tidyr (v.1.3.0) in RStudio (Posit Software, PBC, v.2023.12.0 + 369).Oligonucleotide sequences for Telo-seqTelo-adapter T1: /5Phos/AAGGTTAACACAAAGACACCGACAACTTTCTTCCCCTAAC; Telo-adapter T2: /5Phos/AAGGTTAACACAAAGACACCGACAACTTTCTTCTAACCCT; Telo-adapter T3: /5Phos/AAGGTTAACACAAAGACACCGACAACTTTCTTCCCTAACC; Telo-adapter T4: /5Phos/AAGGTTAACACAAAGACACCGACAACTTTCTTCCTAACCC; Telo-adapter T5: /5Phos/AAGGTTAACACAAAGACACCGACAACTTTCTTCAACCCTA; Telo-adapter T6: /5Phos/AAGGTTAACACAAAGACACCGACAACTTTCTTCACCCTAA; Telo-Splint: GAAGAAAGTTGTCGGTGTCTTTGTGTTAACCTTAGCAAT.Dfam repetitive DNA element analysisTo more generally identify repetitive DNA elements in IMR90 control and IMR90 ATRX-KO ALT Telo-seq data, the presence of Dfam database (v.3.9) instances were quantified in telomeric reads using HMMER (v.3.4; http://hmmer.org/). For each detected Dfam instance, the number of reads with at least one instance per read was calculated using a custom awk script (https://github.com/Salk-IGC/Dfam-Repeat-Quantification). All downstream analysis was performed in R (v.4.3.1) with dplyr (v.1.1.4), ggplot2 (v.3.5.1), stringr (v.1.5.0) and tidyr (v.1.3.0) in RStudio (Posit Software, PBC, v.2023.12.0 + 369). Instances that were not annotated as human- or human-ancestor specific were excluded from downstream analysis. To allow enrichment analysis, read counts with ‘NA’ were replaced with ‘1’ for the instances that were undetected in one sample but present in the other sample. For each instance, the percentage of reads in that instance relative to the total number of telomeric reads per sample was calculated. Ratios and log2-transformed ratios of the percentage of reads with the specific instance found in IMR90 ATRX-KO ALT relative to IMR90 control were calculated for each instance. Enrichment was statistically evaluated by Fisher’s exact test. To exclude subclonal events, all instances with a frequency of less than 1% or 2% in one of the samples, corresponding to approximately one and two chromosome arms per diploid cell, respectively, were excluded in the analysis.Linked-read WGSLinked-Read library preparation was performed according to the 10x Genomics protocol on the Chromium Controller instrument57. Libraries were then sequenced to 30–40× coverage on the Illumina NovaSeq 6000 system and processed using the 10x Long Ranger pipeline (v.2.2.2, default parameters, hg19 reference genome). The sequenced HMW gDNA molecules had a mean length of 80–90 kb, and reads from the same molecule were assigned a standard 16-bp barcode. To detect insertions of satellite DNA into the (sub)telomeric regions of the genome, molecules with two kinds of reads were identified: (1) reads with at least one occurrence of the 17-bp α-sat motif AAACTAGACAGAAGCAT (with up to two mismatches); and (2) reads with at least four occurrences of the telomeric repeat TTAGGG and its reverse complement (no mismatches). Molecules with at least one satellite read and two telomeric reads (all reads sharing the same barcode) were counted as an insertion event. Their number was then normalized to the total number of molecules with telomeric repeat reads only to account for varying telomere lengths between samples.CUT&RUN analysisCUT&RUN for CENP-A was performed with 1 × 10⁶ cells per sample as described previously15,58. Cells were incubated with CENP-A antibody (ADI-KAM-CC006-E, Enzo) overnight at 4 °C, followed by secondary antibody for rabbit IgG (ab46540, Abcam) for 1 h at 4 °C and incubation with pA/G-MNase (Epicypher) at 4 °C for 1 h. Released chromatin fragments were prepared for sequencing using the NEB Ultra II library preparation kit (E7103L). All of the samples were amplified for 12 PCR cycles, then run on a 2% agarose gel, and the band corresponding to mononucleosome fragments (275–350 bp) was selected. Excised fragments were purified by gel-extraction (Qiagen, 28704). The resulting libraries were sequenced using 150 bp, paired-end sequencing on the HiSeq X instrument according to the manufacturer’s instructions (Illumina). Reads generated from CUT&RUN were processed using Cutadapt (v.2.10) to remove adapters and retain reads with a minimum length of 20 bp, then reads were aligned to the CHM13 whole-genome assembly v2.0 (GCF_009914755.1) using bowtie2 (v.2.4.1) with the following parameters: --end-to-end --very-sensitive --no-mixed --no-discordant -I 10 -X 700 --dovetail -p 8. The resulting SAM files were converted to BAM format using SAMtools (v.1.9) with FLAG score 2,308 to remove unmapped, secondary and supplemental alignments. Normalized bigWigs were generated with deeptools (v.3.3.0) using the following command: bamCoverage -b sample.sort.bam -o sample.bw --scaleFactor X -p max/2, where the Escherichia coli spike-in coverage was used to calculate scaling factors for all samples. Significantly enriched CENP-A peaks were determined using MACS2 (v.2.2.7.1) using the default parameters: -g 3.03e9 and -q 0.00001.DiMeLo-seqDiMeLo-seq was performed as described previously16,59. Samples were prepared from 6 million cells. Washed and permeabilized cell pellets were resolved in 400 µl Tween-Wash containing primary CENP-A antibody (ADI-KAM-CC006-E, Enzo) at 1:50. After washing, the CENP-A samples were resuspended in 400 µl Tween-Wash with 200 nM mouse Hia5 nanobody (provided by N. Altemose). After Hia5 activation, cells were resuspended in 40 µl cold PBS and modified UHMW DNA was extracted using the NEB Monarch UHMW DNA Extraction Kit (NEB, T3050) with modifications as directed in the ONT protocol (Oxford Nanopore Technologies). Telomere-to-telomere sequencing was performed on the Promethion system (SQK-APK114, SQK-LSK114 and SQK-ULK114, version T2T_9211_v114_revF_27Nov2024; https://nanoporetech.com/document/telomere-to-telomere-sequencin g-t2t-on-promethion-sqk-apk114-sqk). Libraries were prepared using the ONT Ultra-long DNA sequencing kit (SQK-ULK110). Sequencing was performed with R9 flow cells on the Promethion (Oxford Nanopore) system. Base-calling was performed using guppy (v6.1.2_gpu) and modified bases were identified with all contexts (res_dna_r941_min_modbases-all-context_v001) and CpG (res_dna_r941_min_modbases_5mC_CpG_v001) models with a methylation threshold of 0.05. Reads were aligned to the CHM13 whole-genome assembly v.2.0 (NCBI: GCF_009914755.1) using winnowmap (v.2.03) with the following parameters: -ax map-ont --cs --eqx -Y -L -p 0.1 -I8g. The resulting SAM files were converted to BAM format using SAMtools60 (v.1.12), with a FLAG score of 2,308, to remove unmapped, secondary and supplemental alignments. Modified base tags were combined with winnowmap alignments using Samtools (v.1.12) and a merging script (provided by N. Altemose). Resulting alignments were filtered to isolate haplotypes using Samtools (v.1.12) and to remove low-quality basecalls and/or modifications using a Python script (provided by D. Xu). To further enrich telomeric reads, a biological replicate was performed as above, with the following modifications. Libraries were prepared using the ONT Ultra-long DNA sequencing kit (SQK-ULK114). Sequencing was performed with R10 flow cells on the PromethION (Oxford Nanopore Technologies) system with adaptive sampling using positive selection for telomeres, subtelomeres and centromeres. Base-calling was performed using Dorado (v.0.5.3), and modified bases were identified for 5mC and 6 mA contexts. Fastq output for independent alignment and downstream processing, as specified above. Visualizations of CENP-A (mA) and DNA methylation (mCpG) were generated using the DiMeLo package (https://github.com/streetslab/dimelo).Metaphase spreads (FISH) and chromosome paintTo visualize telomeres and centromeres on metaphase spreads and evaluate telomere integrity, cells were treated with Colcemid (Gibco) for around 2 h, collected by trypsinization, swollen in 0.075 M KCl at 37 °C for 7 min and fixed in 70% methanol:30% acetic acid. Metaphase chromosomes were spread onto glass slides and allowed to dry overnight. The next day, metaphases were rehydrated with PBS and treated with RNase A (0.5 mg ml−1 in PBS) and pepsin (1 mg ml−1 in acidified water). Spreads were then fixed in 3.7% formaldehyde, washed with PBS, dehydrated with ethanol washes (70%, 95% and 100%) and air-dried. As in IF-FISH, metaphase spreads were hybridized with a fluorescently labelled PNA probe specific for the telomere, centromere α-sat sequence or CENP-B (PNA Bio) box at 70 °C for 10 min, then incubated at room temperature for 2 h. The slides were then washed with PNA wash A and B and, similar to the IF-FISH protocol, ethanol-dehydrated, air-dried and mounted in ProLong Gold Antifade reagent with DAPI. Metaphase chromosomes were visualized using a ×60 Plan λ objective (1.4 oil) on a Nikon 90i microscope.For chromosome paint experiments, metaphases were prepared and hybridized with telomere and centromere PNA probes as above. Slides were fixed in 4% PFA after the PNA washes, washed three times with PBS and then dehydrated in ethanol. Then, 8 μl of the chromosome-specific probes was added per slide (Metasystems XCP D-0301-100-FI for chromosome 1, D-0311-100-FI for chromosome 11, and D-0314-100-FI for chromosome 14) and covered with a coverslip and sealed with quick-drying rubber cement. The slides were denatured at 72 °C for 2 min and then hybridized at 37 °C overnight. The next day, the rubber cement and coverslip were removed carefully. Slides were washed first in 0.4× SSC at 72 °C for 2 min, then in 2× SSC with 0.05% Tween-20 at room temperature for 30 s, before a brief rinse in water and air-dried. Metaphases were mounted in ProLong Gold Antifade reagent with DAPI and visualized as above.Metaphase IF-FISHA total of 1,000,000 U2OS cells were seeded onto a 10 cm plate. The next day, they were treated with Colcemid for 2 h, then collected by trypsinization, swollen in 0.075 M KCl at 37 °C for 10 min and cytospun onto slides at 1,800 rpm for 10 min (Thermo Fisher Scientific, Cytospin 4). Slides were immediately fixed in 3.7% formaldehyde for 10 min before permeabilization with 1× KCM supplemented with 0.5% Triton X-100. Cells were then washed with 1× KCM buffer with 0.1% Tween-20 and 0.25% BSA. The slides were blocked for 30 min in 1× KCM buffer containing 0.1% Tween-20 and 2.5% BSA, then incubated overnight in the same buffer with antibodies (CENP-A: Thermo Fisher Scientific, MA1-20832; CENP-C, MBL, PD030; NDC80, Novus Biologics, 9G3.23). The next day, the slides were washed three times with 1× KCM buffer containing 0.1% Tween-20 and 0.25% BSA, then incubated with secondary antibodies for 1 h. The slides were again washed three times, fixed in 3.7% formaldehyde, washed with PBS, dehydrated with ethanol washes (70%, 95% and 100%) and air-dried. As for the IF-FISH, metaphase spreads were hybridized with fluorescently labelled PNA probes as described above.SNAP CENP-A labelling assay for newly deposited histonesU2OS, HeLa LT and U2OSiATRX inducible cells that stably express SNAP-tagged CENP-A were seeded on a 6 cm plate (300,000 cells). The next day, old parental CENP-A was quenched with 10 μM SNAP-cell block (New England Biolabs) for 30 min. This was followed by PBS washes and a 2.5 h chase in fresh growth medium. Newly synthesized SNAP-tagged histone CENP-A that was deposited to chromatin during the chase was pulsed with 2 μM SNAP-cell TMR star (New England Biolabs) for 20 min, followed by a 30 min incubation in fresh medium. Cells were then washed with PBS and analysed using immunofluorescence according to the CSK protocol described above.When studying the effect of siRNA-mediated depletion on new SNAP–CENP-A deposition at telomere breaks, cells were transfected with siRNAs as described above. Then, 48 h later, the cells were transfected with Flag-tagged TRF1-FokI WT or DA using Lipofectamine 3000. After 6 h, the transfected cells were washed, and the medium was replenished. Then, 24 h later, cells were processed for a quench–chase–pulse experiment as above. When studying the effect of DNA methylation inhibition, 100 nM decitabine (Selleck Chemicals, S1200) was added to control and ASF1-depleted HeLa-SNAP–CENP-A cells 24 h after siRNA transfection until fixation at 72 h. For U2OSiATRX cells, 100 nM decitabine was added to cells for the 7 day duration of the experiment.Western blottingCells were collected with trypsin, quickly washed in PBS, counted with Cellometer Auto T4 (Nexcelom Bioscience) and directly lysed in 4× NuPage LDS sample buffer at 10,000 cells per μl. Proteins were gently homogenized using a Nuclease (Thermo Fisher Scientific), denatured for 10 min at 70 °C, resolved by SDS–PAGE electrophoresis, transferred to nitrocellulose membranes, blocked in 5% milk in TBST for 30 min and probed. HRP-linked anti-rabbit or mouse (Amersham) was used for secondary antibodies, and the HRP signal was visualized with SuperSignal ECL substrate (Pierce). Antibodies for western blots used in this study include ASF1A (1:1,000, Cell Signaling Technologies, 2990), ASF1B (1:1,000, Cell Signaling Technologies, 2769); HRP-conjugated GFP (1:5,000, Miltenyi Biotech, 130-091-833), tubulin (1:5,000, Sigma-Aldrich, T-6557), ATRX (1:1,000, Cell Signaling Technologies, 14820), HJURP (1:1,000, Bethyl Laboratories, A302-822A), POLD3 (1:1,000, Abnova, H00010714-M01), RAD51 (1:1,000, Abcam, ab133534), RAD52 (1:300, Santa Cruz), cyclin B1 (1:1,000, Cell Signaling Technologies, 12231), phospho-histone H3.3 Ser31 (1:1,000, Active Motif, 39637), POLH (1:1,000, Cell Signaling Technologies, 13848), DNMT1 (1:1,000, Cell Signaling Technologies 5032) and Flag M2 (1:1,000, Sigma-Aldrich, F1804). BLM antibody (1:1,000) was generated in the laboratory of J. Karlseder.BrdU IPBrdU IP was performed as described previously38. Cells were transfected with siRNAs. Cells were then left either untreated (asynchronous) or treated with nocodazole for 17 h (100 ng ml−1; Selleck Chemicals) to arrest at the G2/M checkpoint. To evaluate DNA synthesis during mitosis, nocodazole-treated cells were washed twice and released into fresh medium for 3 h. For all these experiments, cells were pulsed with 100 μM BrdU (Sigma-Aldrich) for 2 h before collection. gDNA was isolated using phenol–chloroform extraction and then sonicated into around 200-bp fragments using a Covaris Sonicator. Equal concentrations (4 μg) of sonicated DNA for each condition were subjected to downstream analysis. Sonicated DNA was denatured at 95 °C for 10 min before incubation with 80 μl of the anti-BrdU antibody (25 μg ml−1; BD Biosciences) diluted in immunoprecipitation buffer (IP buffer, 0.0625% (v/v) Triton X-100 in 1× PBS) overnight at 4 °C. The next day, samples were incubated overnight at 4 °C with 30 μl of protein G magnetic beads (Pierce) pre-bound to a bridging antibody (Active Motif). The next day, beads were washed three times on a rotator at 4 °C with IP buffer, then once with TE buffer, before being eluted in 50 µl of elution buffer (1% (w/v) SDS in TE) for 15 min at 65 °C. The final step was repeated to achieve a final volume of 100 μl of eluted DNA. Eluted DNA was cleaned using the ChIP DNA Clean & Concentrator kit (Zymo Research). The samples, along with 10% of input DNA (around 400 ng of sonicated DNA), were diluted into 2× SSC and heated at 95 °C for 5 min and cooled before being dot-blotted onto an Amersham Hybond-N+ nylon membrane (GE) for a telomere Southern blot. The membrane was denatured (1.5 M NaCl with 0.5 M NaOH) for 10 min, neutralized (1 M NaCl with 0.5 M Tris-HCl pH 7), before cross-linking with ultraviolet light. The membrane was hybridized overnight with 32P-labelled (TTAGGG)3 oligonucleotides in ultrasensitive hybridization buffer (Invitrogen) at 55 °C. The next day, the membrane was washed thrice in 4× SSC, once in 4× SSC with 0.1% SDS, then exposed to a storage phosphor screen (GE Healthcare) and scanned using an Amersham Typhoon Scanner (Cytiva). Signal intensities were quantified using Fiji and normalized to 10% input.Cell cycle synchronizationA total of 800,000 U2OS cells was seeded onto a 10 cm plate with two glass coverslips per plate. The next day, cells were transfected with 5 µg of the GFP-tagged HJURP plasmids. Then, 6 h after transfection, cells were washed twice with PBS and then either supplemented with fresh medium (asynchronous) or treated with 100 ng ml−1 nocodazole (Selleck Chemicals) for 16 h to arrest at the G2/M checkpoint. Cells were then either left in nocodazole or washed twice before being released into fresh medium. Cells were collected for IF and western blot analysis at 2-, 3- and 5 h after release.MiDAS assaysAsynchronous cells were treated with 10 μM CDK1 inhibitor RO-3306 (Selleck Chemicals) for 16 h to enrich for mitotic cells. Cells were then rinsed with PBS (37 °C) three times before being released into fresh medium containing 10 μM EdU and 0.1 μg ml−1 colcemid (Karyomax, Thermo Fisher Scientific) for 1 h. Cells were then collected by mitotic shake-off and pelleted. Cells were subsequently swollen in 0.075 M KCl at 37 °C for 7 min and fixed in 70% methanol:30% acetic acid. Metaphase chromosomes were spread onto glass slides and allowed to dry overnight. The next day, metaphase chromosomes were rehydrated and processed as described in the ‘Metaphase spreads (FISH) and chromosome paint’ section, using an Alexa Fluor 488-conjugated telomere PNA probe (PNA Bio, F1004). After PNA washes, cells were blocked with blocking buffer (3% BSA in 1× PBS) for 30 min and a second wash for 20 min (0.5% Triton X-100 in 1× PBS) for 20 min at room temperature. EdU detection was then performed using Click-IT chemistry according to the manufacturer’s instructions (Click-IT EdU; Alexa Fluor 647 Imaging Kits, Life Technologies) for 30 min. Slides were washed three times for 5 min each in a wash buffer (3% BSA in 1× PBS with 0.5% Triton X-100) at room temperature. Finally, slides were rinsed with water, air-dried and then mounted with ProLong Gold Antifade Reagent with DAPI.HJURP–TRF1 tethering experimentsIn total, 400,000 U2OS cells were seeded onto a 6 cm plate with two glass coverslips per plate. The next day, cells were transfected with 1 µg of the eGFP–TRF1 and 2 μg of WT and ΔTLTY eGFP-HJURP-TRF1 constructs. Then, 6 h after transfection, cells were washed twice with PBS and then supplemented with fresh medium (asynchronous). Cells were collected for immunostaining and western blot analysis at 48 h after transfection.dCas9-TET1-CD targeting experimentsThe pInducer plasmids dCas9-TET1-CD-WT (101921) and dCas9-TET1-CD-mut (101920) were obtained from Addgene. The plasmid lentiguide-puro (52963) was obtained from Addgene and used to express sgTel (TTAGGGTTAGGGTTAGGGTTAGG) for telomere targeting. Underlined bases indicate PAM sequence. Then, 400,000 U2OS cells were seeded onto a 6 cm plate with two glass coverslips per plate. The next day, cells were transfected with 2 μg of each plasmid. Next, at 6 h after transfection, cells were washed twice with PBS and then supplemented with fresh medium with 200 ng ml−1 doxycycline to induce expression. Cells were collected for immunostaining and western blot analysis at 48 h after transfection.Quantification and statistical analysisAll data in this study were analysed in GraphPad Prism, ImageJ and Microsoft Excel. All data were assembled into figures with Adobe Illustrator 2023. Detection, co-localization and quantification on micrographs were performed using the ComDet v.0.5.3 plugins for ImageJ. Statistical tests used are indicated in the figure legend accompanying each figure. In most cases, and unpaired two-tailed t-tests or a one-way analysis of variance (ANOVA) with a Dunnett’s post-test were used to determine statistical significance. n values refer to the number of independent experiments and the number of cells analysed, as indicated. No statistical methods were used to predetermine sample size. The experiments were not randomized, and the investigators were not blinded to allocation during the experiments or to outcome assessment.Reporting summaryFurther information on research design is available in the Nature Portfolio Reporting Summary linked to this article.
Centromeric footprints preserve telomere integrity in ALT cancers - Nature
Centromeric DNA repeat insertions and CENP-A chromatin assembly are identified as genomic signatures that preserve telomere integrity in ALT cancer cells.
15,818 words~72 min read