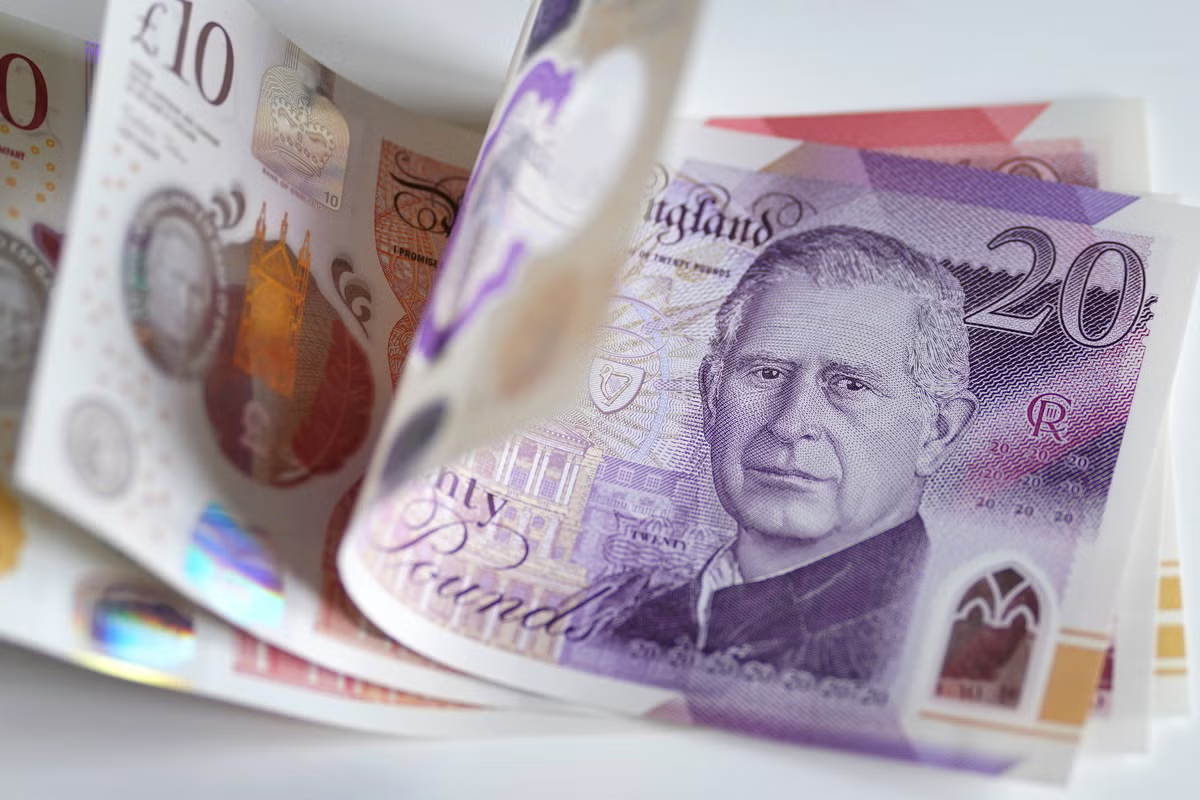
With middle-earners and the wealthy alike bearing the brunt of Labour‘s tax raids, the question of who of us feels rich has never been more pertinent.Wealth is of course different to income but, while the former is key to genuine riches, when when it comes to whether you feel better off or not, it's usually the money coming in that matters.So with millions of households feeling the pinch – and fearing the worst on tax – are you better or worse off than your friends, neighbours and others in similar jobs and towns to you? Do you earn more or less than the average person who does your job, or the typical worker where you live? And how much of your income is getting eaten by tax?You can use our special calculator here, which draws on official Office for National Statistics (ONS) data, to see how your salary stacks up, where the highest earners live in the UK and what the best and worst paid professions are.Enter your salary, age and postcode into the tool below and see how you compare. Plus, we have analysed the data to tell you what you need to know about the state of Britain‘s earnings today.> The best paid jobs... and careers that saw the biggest pay rises this year
How to use the salary calculatorOur calculator uses figures from the ONS, which are released every year, and give a snapshot of the average earnings in every occupation.The figures, based on 2024 salaries, are the median, which is when you line up all the earners for that job in a row, from lowest to highest, and then take the middle figure for your average.It does not use the ‘mean’ figure, which would be adding up all salaries for an occupation and dividing them by the number of jobs to get an average figure.The median figure gives a better picture of the average individual’s income, and is less likely to be skewed by a few very high or very low earners.While the figures give a good snapshot of the average salary for occupations, it’s not fully representative of what some employees earn. Some will be paid more, others will be paid less and the length of time people have been working for and where they do their job will heavily influence that.Finally, the figures are based on payments made to both full-time and part-time employees, using Pay As You Earn (PAYE) records.Our calculator will also show you your income after tax, National Insurance and student loan payments, and your average monthly wage.You can also see how your pre-tax salary compares to every other salary, regardless of your occupation. For example, if you earn £25,000 pre-tax, you will find that you earn less than 67 per cent of the population, but if you earn £35,000, you earn more than 56 per cent of all employees. How do you compare? Our calculator shows you how your salary compares to othersWhich professions are paid big bucks?The average salary for full- and part-time employees is £31,602, which is around £25,512 after income tax and National Insurance contributions.Pilots and air traffic controllers top the list of high earners in the UK with a median salary of £96,415, or £66,478 after tax. This puts them in the top 7 per cent of earners. Next on the list are marketing, sales and advertising directors, who earn an average of £82,962, or £58,675 after tax.Chief executives and senior officials are also among the highest earners with a median salary of £81,776. While this headline figure might seem low, it covers chief executives at big and small businesses, not just those of listed companies who take home millions.High earners in the public sector earn significantly less than those in the private sector. For example, senior police officers earned £63,986 on average in 2024, still putting them in the top 15 per cent of earners, while sergeants and below were paid £46,436.In the medical field, paramedics took home £52,241 on average, while specialist nurses and nurse practitioners were paid £40,759 and £39,292 respectively.Specialist medical practitioners including surgeons and anaesthetists were on the higher end, taking home £70,192 on average, placing them in the top 12 per cent of earners, while GPs earned £45,506.In the middle, scaffolders, stagers and riggers took home £38,077, while electricians and plumbers earned £38,675 and £37,414 on average, respectively.While these figures offer a good indication of how much people in each profession earn, the amount that they take home will vary according to their age.For example, someone under the state pension age earning £25,000 will take home around £21,543 a year, or £1,795 per month. However, someone who has reached the state pension age with the same income will take home more – £22,537 a year, or £1,878 per month – because they no longer pay National Insurance. Similarly, a 50-year-old chief executive earning the average £81,776 salary takes home £57,987 after tax, but a 70-year-old would earn £61,634, nearly £4,000 more a year.Student loan repayments will also affect your take-home pay. The amount that you pay back depends on which plan you are on and how much you earn. For example, a chief executive on an average salary but paying back their Plan 1 loan will earn £52,973 – nearly 10 per cent less than if they had no student loan – or £53,190 if they’re on Plan 2.For lower earners, an employee earning £30,000, or £25,120 after tax, will have to pay back around £300 on their Plan 2 repayment plan every year, or nearly £500 on Plan 1.