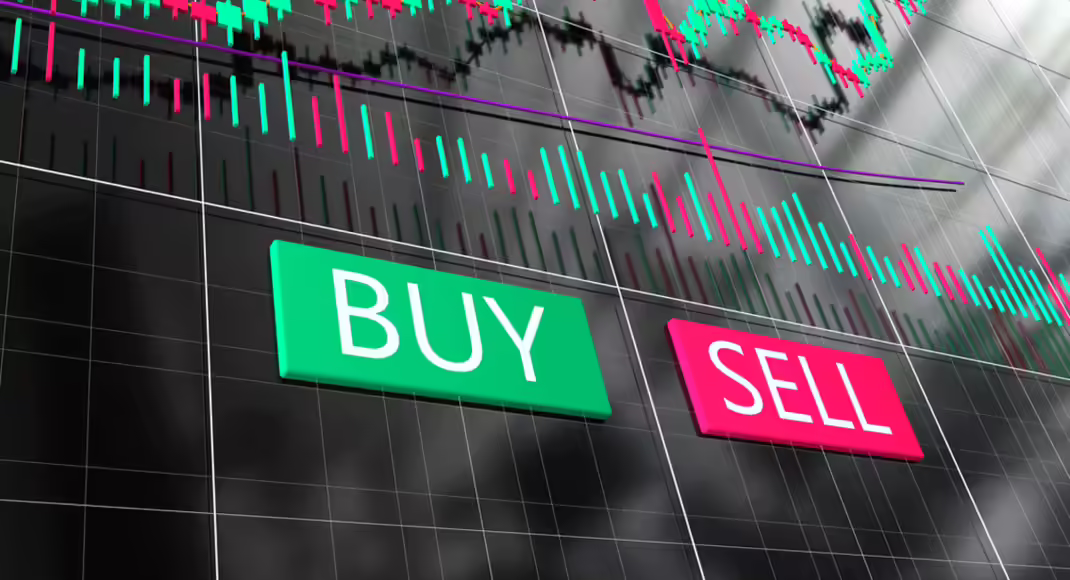
For equity investors, valuation is one of the most important tools; however, it doesn’t drive markets on its own, especially in the short term. A fundamentally strong stock can remain under pressure for months if sentiment is weak. On the other hand, expensive looking stocks can keep rallying, supported by momentum, liquidity and strong investor participation. That’s where technical analysis comes into play.Technical analysis studies price movements to understand market trends and investor behaviour. It is built around price charts that help investors identify trends and predict market movements. The analysis can be performed across multiple time frames: daily, weekly, monthly, or even intraday. While short-term traders rely on daily charts, long-term investors often track weekly and monthly charts to understand the broad trends. At its core, technical analysis assumes that prices reflect available information, follow trends, and often repeat past patterns driven by investor psychology.Fundamental investing and technical analysis are often seen as opposing approaches, but in practice, they work well together. A combined approach offers a more balanced framework for retail investors. Fundamentals help identify good businesses (those with strong earnings, solid balance sheets and reasonable valuations) while technicals indicate whether market sentiment is currently aligned with that view. In simple terms, valuation helps answer what to buy, while technical analysis helps decide when to act.That said, technical analysis isn’t a magic formula. It works with probabilities, not certainties. This is because market outcomes are shaped by factors such as economic data, global developments, corporate earnings, interest rates, and overall investor sentiment. Changes in any of these can invalidate even the strongest technical setup. Some of the introductory tools used in technical analysis:Charts: the starting pointSeveral types of charts are used; line, bar and candlestick.A line chart connects closing prices over a period using a continuous line. It is generally used by beginners.A bar chart is a more detailed chart that shows open, close, high and low prices. Useful in analysing volatility.The candlestick chart is a widely used chart type in modern technical analysis. It displays open, high, low, and closing prices using candle-like structures.Trend: the cornerstoneTrend analysis is the process of identifying the overall direction of a stock or market.Markets generally move in three directions: Uptrend: when prices move higher over time.Downtrend: when prices move lower over time.Sideways trend: when prices move within a range without a clear direction.How to identify a trend?Uptrend: a stock making higher highs and higher lows. Example: a stock rises from Rs.500 to Rs.520, falls to Rs.510, then rises again to Rs.530. Here, both the high (520 to 530) and the low (500 to 510) are moving higher.Downtrend: a stock keeps making lower peaks and lower bottoms, indicating sustained selling pressure. Example: A stock falls from Rs.1,150 to Rs.1,130, rebounds to Rs.1,140, and then declines again to `1,120. Here, both the high (1150 to 1140) and the low (1130 to 1120) are moving lower.Sideways trend: Prices fluctuate within a defined range.How to use and its importance?Buy or accumulate stocks during uptrends.Avoid aggressive buying during strong downtrends.Helps investors avoid trading against market momentum.Improves entry and exit timing. Useful for short-term trading, long-term investing.Support and resistance: market psychologySupport is a price level at which buying interest emerges, while resistance is a price level at which selling pressure increases.In support, buying interest is strong enough to prevent the stock from falling further. Comparatively, at resistance, the selling pressure is strong enough to halt a stock’s upward movement.These levels reflect collective investor behaviour and sentiment.How to use it?Investors use support levels to identify potential buying opportunities and resistance levels to identify possible selling zones or breakout points.When the price rises above resistance, it is often viewed as bullish, while a price fall below support can signal weakness.LimitationsFalse breakouts are common.Sudden news events or market volatility can invalidate these levels quickly.Moving averages: filtering noiseA moving average calculates the average price of a stock over a specified period.Commonly used averages include the 20- day, 50-day, and 200-day moving averages.Help smooth out short-term price fluctuations and identify broader trends.How to use it?When a stock moves above a key moving average, it generally indicates positive momentum. And, when a stock price falls below a key moving average, it may suggest weakness.Long-term investors generally monitor the 200-day moving average, which is widely viewed as a key indicator of market trend.A sustained price level above the 200-day average is often considered bullish, while persistent trading below it may indicate broader weakness.A crossover of two moving averages also provides important signals.When short-term averages (say 20-day) rise above long-term averages (say 50-day), it indicates strengthening momentum, while the opposite may signal weakness.LimitationsNot helpful during sideways markets.Reacts slowly during sharp market reversals.What charts can tell you
Want to read market trends better? Start with these 5 basic technical analysis tools - The Economic Times
Technical analysis helps investors understand market trends and sentiment through price charts, complementing fundamental analysis, which identifies quality businesses. Key tools include charts, trend analysis, support and resistance levels, moving averages, and trading volumes. While technical indicators can improve entry and exit timing, they work on probabilities, not certainty. Experts advise retail investors to prioritise fundamentals and use technical analysis only as a supporting tool.
997 words~5 min read