The stock continued to benefit from AI-driven momentum, with investors buying pullbacks despite the stock’s roughly 76% gain over the past year.Analysts Remain Bullish On AI OpportunityBroadcom also continues drawing support from bullish AI infrastructure commentary on Wall Street. Catalyst Funds CIO David Miller told CNBC that Broadcom remains one of the strongest AI infrastructure plays despite its premium valuation, citing multiple growth drivers across custom AI chips, networking infrastructure and enterprise software.Miller said the company benefits from supplying hyperscalers with custom AI semiconductors while also generating strong growth from networking products and cloud software businesses, positioning it to capitalize on expanding AI infrastructure demand.Meanwhile, Aletheia Capital reiterated its Buy rating on Broadcom and raised its price forecast to $525 from $500.According to Aletheia, Google appears to have adjusted its inference TPU strategy, with TPUv8i expected to remain in use through 2027 and 2028. The firm added that rising inference demand and increasing networking content per deployment continue to support Broadcom’s revenue and earnings growth outlook through fiscal 2027.Technical AnalysisBroadcom is in a clear longer-term uptrend: the stock is trading 2.7% above its 20-day SMA ($421.44) and 23.1% above its 200-day SMA ($351.63), which keeps the bigger-picture trend pointed up. The 20-day SMA is also above the 50-day SMA, and the golden cross that formed in April (50-day moving above the 200-day) reinforces that the intermediate trend remains constructive.Momentum is where the chart gets more nuanced: MACD is below its signal line and the histogram is negative, which suggests upside pressure is cooling versus the prior upswing. In plain terms, MACD compares shorter- and longer-term trend momentum, and being below the signal line often means buyers may need a fresh push to keep the rally accelerating.From a levels standpoint, the stock is pressing into an area just below its 52-week high ($442.36), so traders tend to watch for either a clean breakout or a rejection that triggers profit-taking. A pullback that holds above the 20-day/50-day trend zone would typically be read as consolidation within an uptrend rather than a full trend break.
What's Going On With Broadcom Stock Friday? - Broadcom (NASDAQ:AVGO)
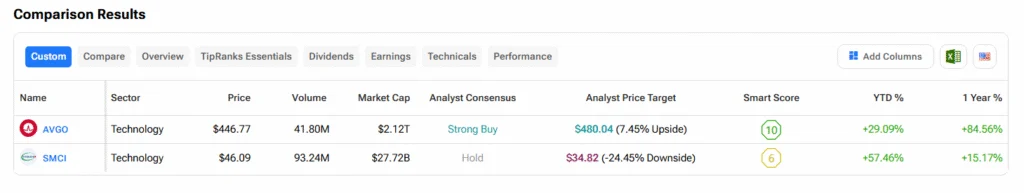
Broadcom (AVGO) reports earnings June 3 with revenue expected to hit $22.08B. Is the stock a buy at its current premium valuation?
476 words~2 min read