LIVE: North-South grade divide reaches record gap as boys outperform girls in top marks - live updatesREAD MORE: Going through clearing? Don't miss the Daily Mail's definitive interactive 2026 guide to every university in Britain, ranked from best to worstBy OLIVER PRICE, PUZZLES EDITOR Published: 10:09 BST, 14 August 2025 | Updated: 10:45 BST, 21 August 2025
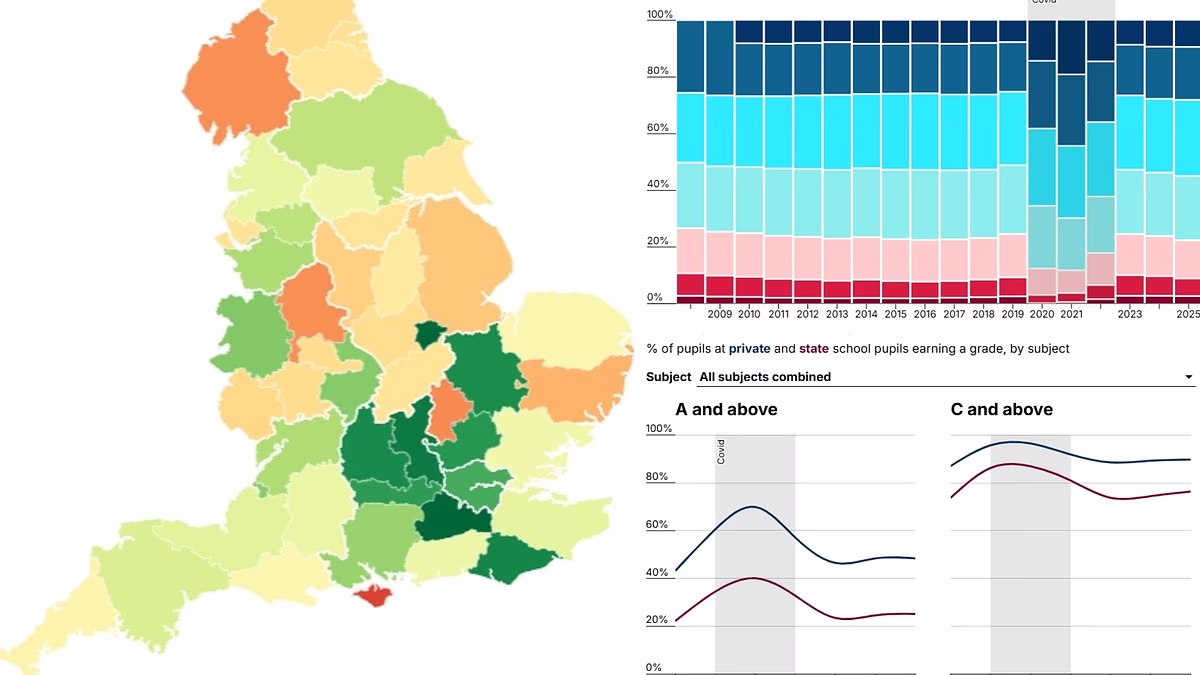
View the full A-level results day 2025 statistics with the Daily Mail's collection of graphics.A-level A* and A rate by county and subject: 2025This map shows the percentage of pupils who earned the top A* or A grades at A-level in every county in England. You can chose a county by hovering over it or using the search bar.The map's default view is for all subjects, but it can be filtered by individual subject. For a more detailed breakdown, including historic results by county and your chosen tap or click on a map area, or type in the 'Search county...' box.
A-level results by subject: 2008–25The chart below shows the the percentage of pupils who achieved each grade – A* to U – in England for each year between 2008 and 2025.You can select the results for each subject, such as maths, English or physics, to see how well students did.